
POTM Blog Issue #21, August 30, 2026
The TIC Turn
Houses get the headlines and condos get the averages. This issue is about the third product, the tenancy in common flat: what it actually is, what it costs to carry, where it is suddenly competitive, and why the folk wisdom about it, cash only, hard to sell, does not match the data.
By Paulo Serna, San Francisco Real Estate Agent, Compass | Level Up Group · CA DRE# 02150409 · Published August 30, 2026
Data source Paulo’s Pulse, governed SFAR MLS data
Every San Francisco buyer learns the two-product story: houses and condos. There is a third product, and most buyers have been taught to walk past it. In the last six months it quietly outran the condo market.
A tenancy in common, a TIC, is a share of a whole building rather than a legally separate unit. You own a percentage of the property together with your neighbors, and a written agreement gives you the exclusive right to your flat. It is how San Francisco carved thousands of its Victorian and Edwardian buildings into homes people could actually buy, and it comes wrapped in a thick layer of folklore: hard to finance, hard to resell, the discount product you settle for. Some of that folklore was earned years ago. The current data does not support most of it.
The turn
A year ago, the TIC market looked like the slow lane. The median TIC sale, in the six months ending August 2025, closed at asking after a median 37 days on the market. Only 13.6% of sales cleared asking by 10% or more.
The last six months: median +5.8% over asking, median 16 days, and 39.8% of sales clearing asking by double digits. That last number nearly tripled in a year, and it now runs ahead of condos, where 29.6% of sales cleared 10% or more. On 176 sales against 169 the year before, this is the same market moving at a different speed, not a different market.
Condos warmed this year too, as we covered in Issue #20. But the TIC move is larger on every measure: market time cut by more than half, the over-asking share up 21 points, the median price up from $1,000,000 to $1,205,000.
The decade behind the turn
One year of improvement could be a bounce. So we ran the same measures for every year since 2016, comparing January 1 through August 29 of each year so no season gets an unfair edge. The full table is in By the numbers, and it reads as four acts.
From 2016 to 2019, the TIC was a genuinely competitive niche: a few points over asking, roughly a month to sell, with 2018 the peak at +5.6% and 38.5% of sales clearing double digits. Then the strange chapter: 2020 stalled, and 2021 delivered the decade's highest volume, 294 sales by late August, at its slowest speed, 45 days, and flat pricing. Buyers took the discount product in quantity without competing for it. From 2022 through 2025 came the long flat: the median TIC sale closed exactly at asking four years running, and 2023 was the true bottom, when just 2.2% of sales cleared asking by 10% or more.
Now put 2026 against all of that. The over-asking share, 61.2% year to date, is back to 2016-2018 levels. The double-digit overbid share, 34.2%, is second only to 2018. Those are echoes of the old peak. The speed is not an echo of anything: 18 median days, against a decade in which no year broke 29. Median price and price per square foot, $1,178,000 and $978 year to date, are decade highs; the 2018 peak never got past $899 a foot. In plain terms, 2026 is running 2018's level of competition at twice 2018's speed and at record prices. That is not a market returning to an old normal. There is no year in the last ten that looks like this one.
A note on windows so the numbers do not appear to disagree: the decade table compares January-to-August years, where 2026 stands at +2.9% over asking, while the rest of this issue quotes the trailing six months, +5.8%. Both are correct; the year-to-date figure includes the cooler January and February.
What the product actually is
The data draws a very specific picture of the TIC for sale in 2026. Its median building went up in 1909; the median condo's went up in 1989. Its median size is about 1,200 square feet, essentially the same as the median condo. Its median reported dues are $450 a month against $823 for condos, because a small self-managed building carries no tower payroll. And it sells for a median $986 per square foot against $1,101, a 10.4% discount for a similar-sized home.
Put that next to Issue #20's finding, that low-dues flats in older buildings were the hottest corner of the attached-home market, and the TIC turn stops being surprising. The TIC is the original low-dues flat. It is the product that finding was describing, one legal structure over.
The folklore check
The loudest piece of TIC folklore is that they are cash-only. In the last six months, of TIC sales with reported financing, 24.7% were cash. Condos ran 37.0% cash in the same window. Half of TIC sales closed with conventional loans. Read that carefully: the supposedly unfinanceable product had a lower cash share than the mainstream one. Fractional TIC financing is a real, established market now; its rates and terms do differ from condo loans, which is a conversation for a TIC-experienced lender, not a reason to skip the open house.
The second piece of folklore is that TICs are a dying format. Since 2016 the market has closed between 232 and 326 TIC sales every year, outside the everything-spike of 2021. This year is pacing at the top of that range. A steady tenth of the flat market for a decade is not a fad and not a fade. It is a lane.
Where the heat is, and one puzzle
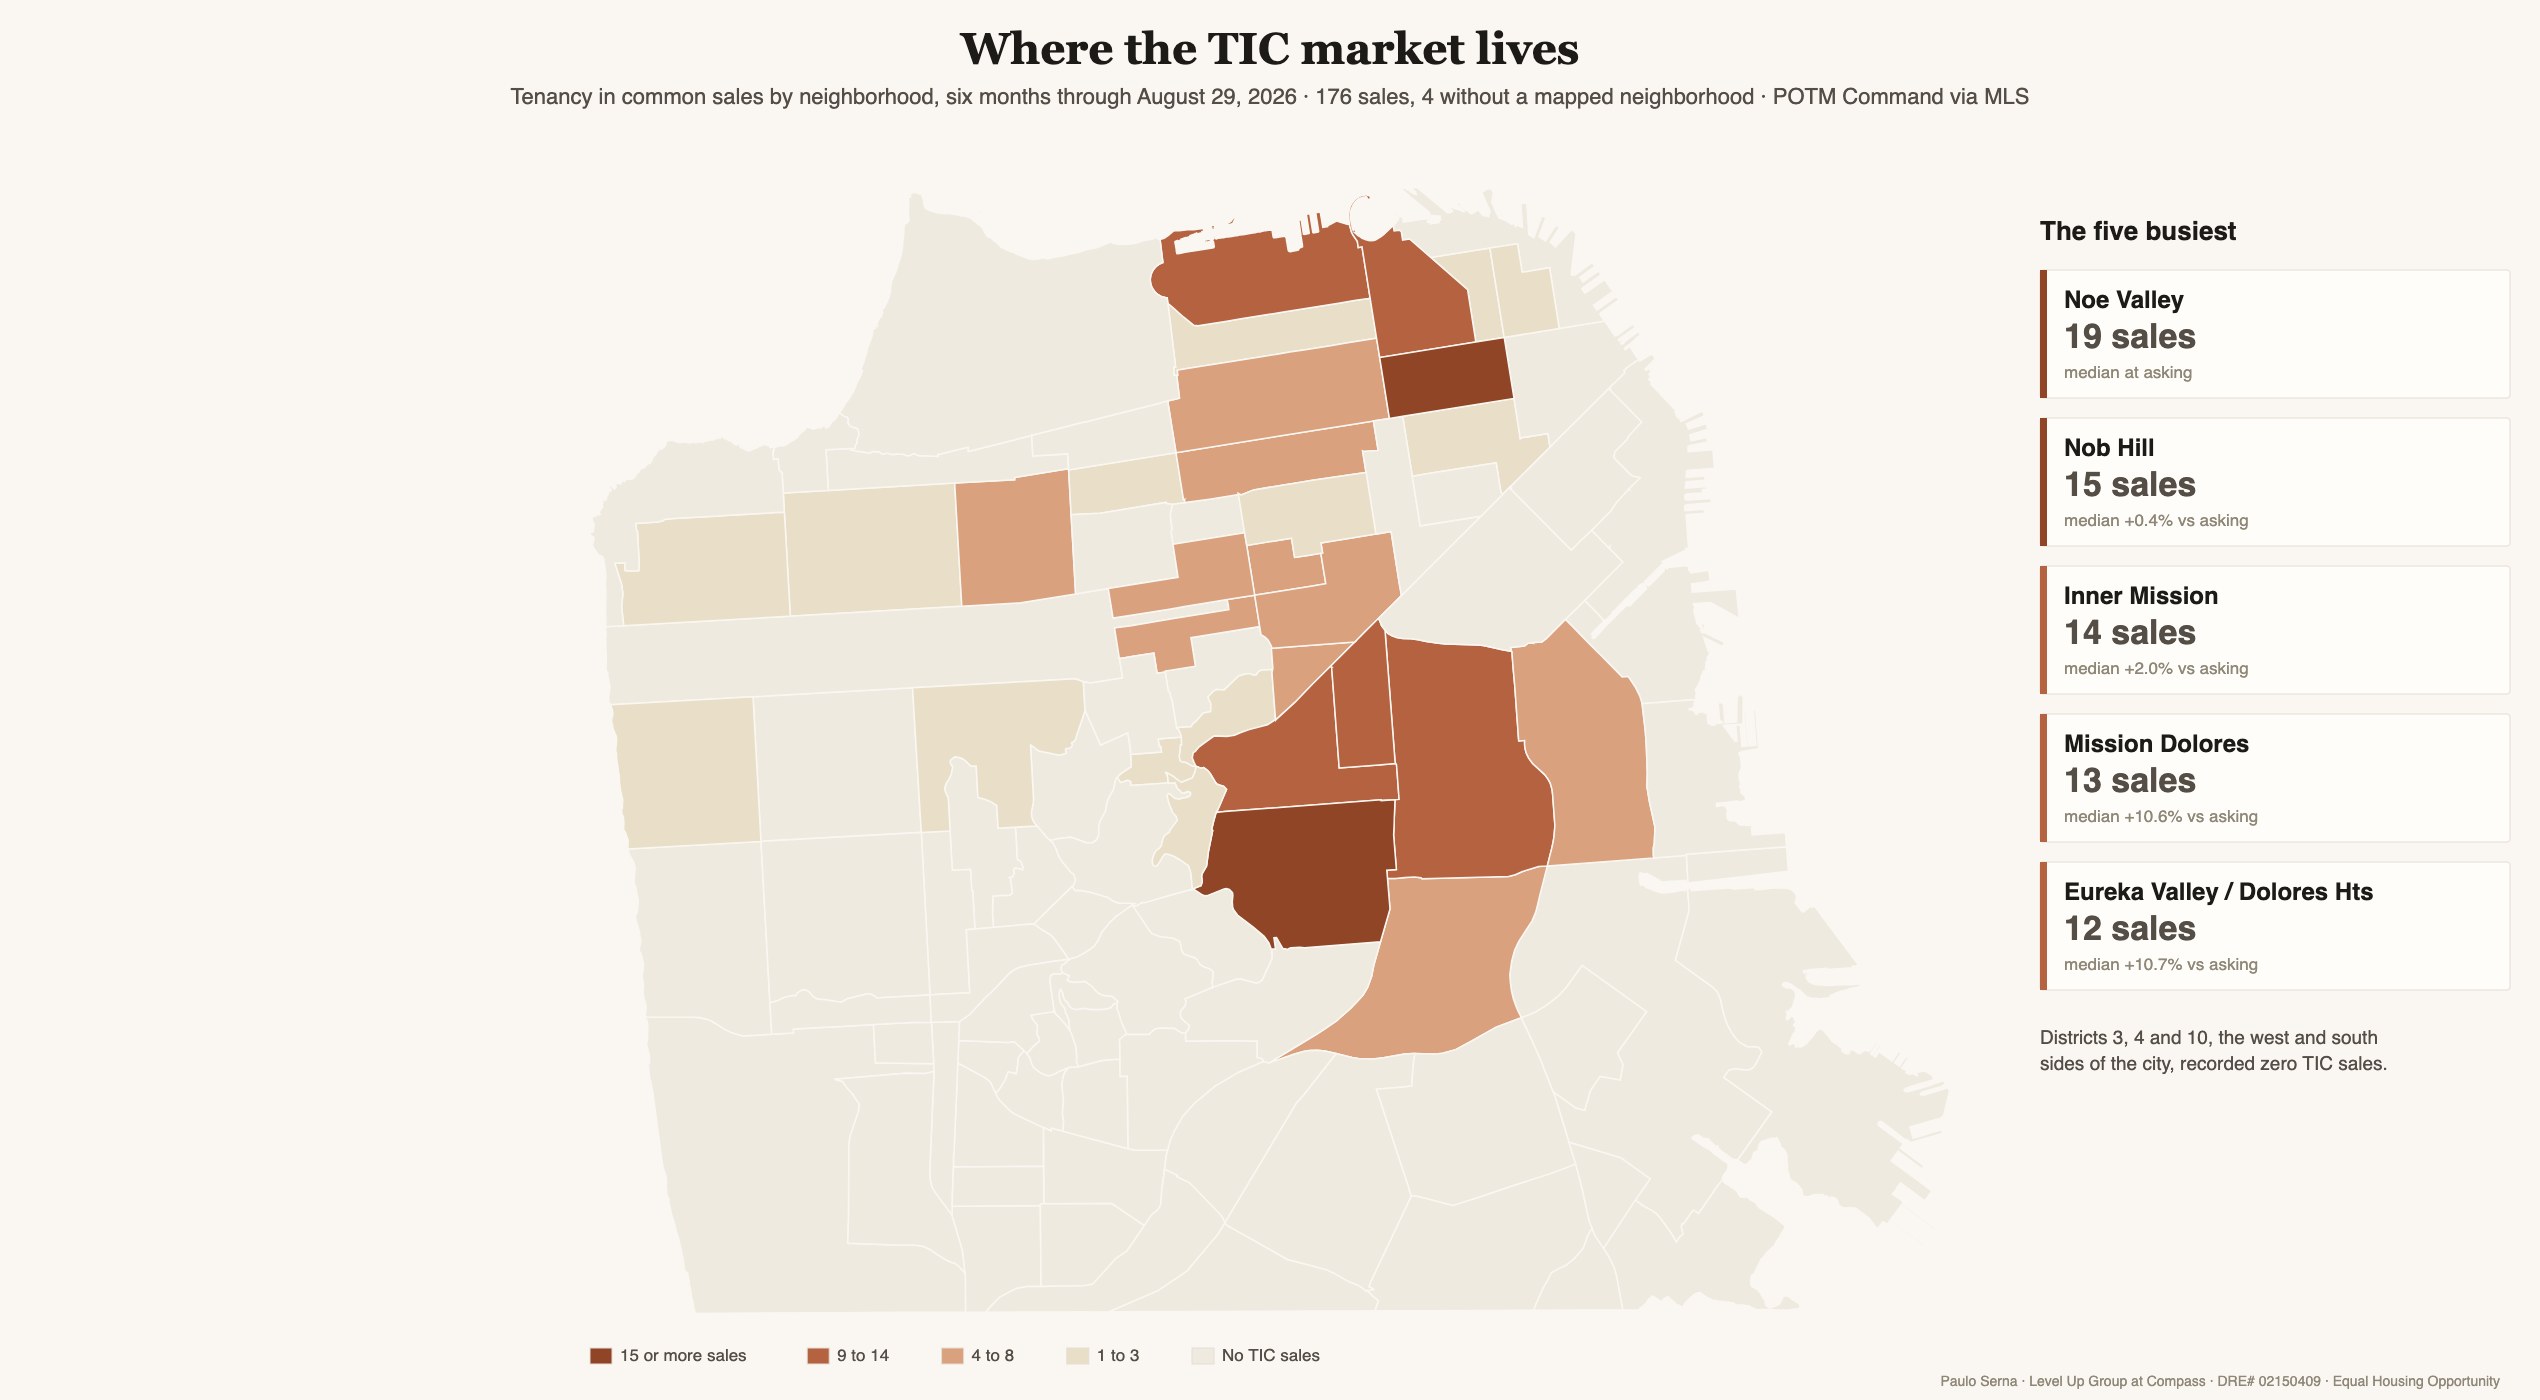
The TIC map does not copy the condo map. The hot end is the north side: District 6 ran +12.0% over asking with 80% of sales clearing, District 7, the Marina and Pacific Heights, +11.9%, District 1, the Richmond, +12.7% on a smaller, Directional sample. The Marina itself ran +17.8% on 9 sales, Directional, and Mission Dolores +10.6% on 13. And where the housing stock is single-family, the product simply is not there: Districts 3, 4 and 10 recorded zero TIC sales in the window.
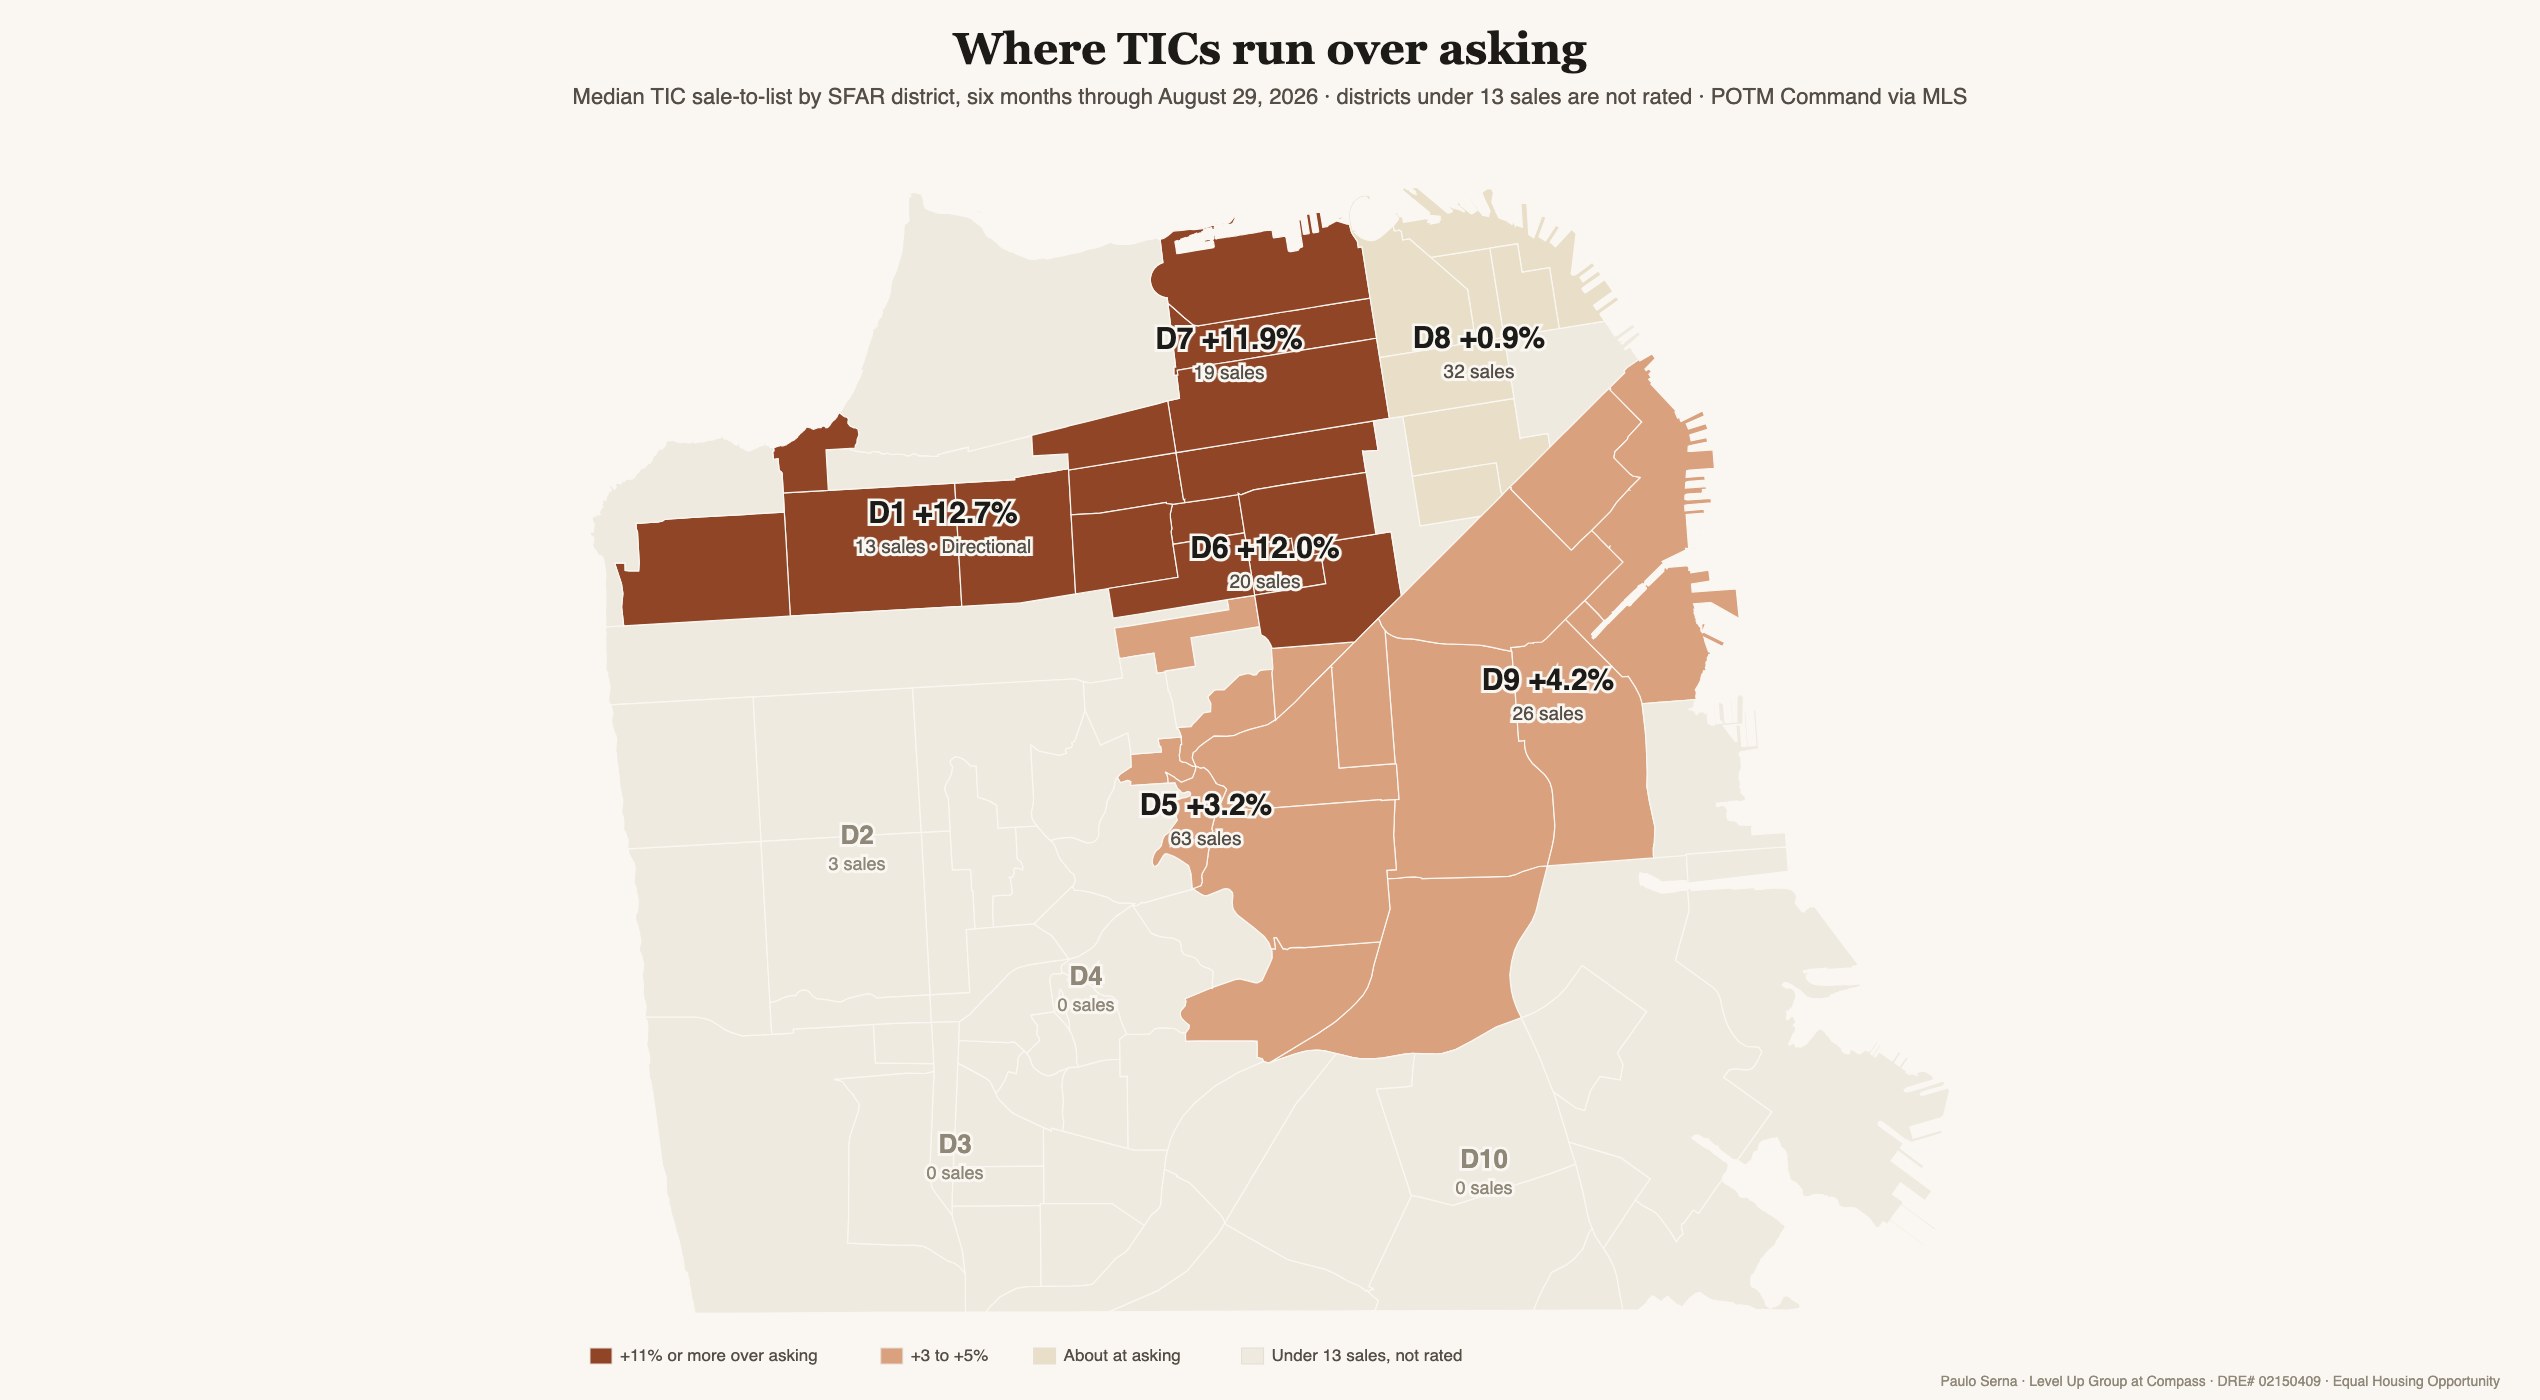
The volume center is calmer: District 5 produced 63 TIC sales, more than a third of the city's total, at a median +3.2%. And one genuine puzzle: Noe Valley TICs closed at asking on 19 sales in the same six months that Noe Valley condos ran +16.6%. One neighborhood, two attached products, sixteen points apart. Thin samples wobble, but that gap is worth watching rather than explaining away.
How to use this
If you are a buyer priced out of condos in the neighborhoods you want: the TIC is the discount door, and the discount is real, about 10% per square foot plus roughly half the monthly dues. The trade is legal structure, not location or light. Walk in with a TIC-experienced attorney and lender and you are negotiating from knowledge while other buyers are still repeating folklore. And go soon: a 16-day market is not waiting for anyone to finish their research.
If you own a TIC and have thought about selling: this is the best exit window in at least a decade of data. Nearly two in three TIC sales now clear asking, and none of the last ten years sold faster. Price it like the competitive product it currently is, in your subdistrict, against the last six months.
By the numbers
| Year, Jan 1 to Aug 29 | Sales | Median vs asking | Median days | Sold over asking | Went 10%+ over | Median $ per sq ft |
|---|---|---|---|---|---|---|
| 2016 | 152 | +2.6% | 39 | 62.5% | 21.1% | $695 |
| 2017 | 155 | +3.4% | 34 | 61.3% | 25.2% | $737 |
| 2018 | 174 | +5.6% | 29 | 67.2% | 38.5% | $863 |
| 2019 | 182 | +1.4% | 31 | 57.7% | 19.2% | $896 |
| 2020 | 139 | At asking | 35 | 43.2% | 9.4% | $899 |
| 2021 | 294 | At asking | 45 | 45.9% | 16.0% | $891 |
| 2022 | 220 | +0.1% | 34 | 51.4% | 20.9% | $892 |
| 2023 | 178 | At asking | 36 | 30.9% | 2.2% | $863 |
| 2024 | 171 | At asking | 34 | 41.5% | 15.2% | $861 |
| 2025 | 204 | At asking | 37 | 41.2% | 12.7% | $850 |
| 2026 | 219 | +2.9% | 18 | 61.2% | 34.2% | $978 |
AI Corridor Scoreboard
One reading per issue on the city's softest segment, the condos near the new AI offices, so you can watch the turn as it happens.
| Issue | Date | Reading | Call |
|---|---|---|---|
| #21 (this issue) | Aug 30, 2026 | Still the calm end of the map. South Beach at asking on 167 sales with 29.9% over; SoMa, Mission Bay and Van Ness / Civic Center at asking; Yerba Buena 1.7% below. Meanwhile 56.6% of condos citywide now clear asking, up from 36.4% a year ago. | The negotiator's end of the market, with the floor rising underneath it. |
| #20 | Aug 25, 2026 | Two markets, one label. Corridor towers still at or below asking over the past six months (South Beach at asking on 168 sales, Yerba Buena -2.2%) while low-dues flats citywide cleared 10%+ over in 59.9% of sales. | Check the dues before you plan the offer. |
Show the 17 earlier readings
| Issue | Date | Reading | Call |
|---|---|---|---|
| #19 | Aug 18, 2026 | Where cash buys the most and shouts the least. Corridor condos ran 41.7% cash in the past 12 months, the heaviest concentration this series tracks, yet cash and financed closed at the same price, 99.2% versus 99.3% of asking. Cash's whole edge here is the clock: 20 median days on market against 39 financed. | Financed buyers give up nothing on price here; they pay in patience. |
| #17 | Aug 9, 2026 | Zero, which is the cleanest reading this scoreboard has produced. Across 368 corridor condo closings so far in 2026, not one sold $1,000,000 over asking, and the typical one closed slightly under asking: South Beach 0.7% below on 183 sales, South of Market 1.0% below on 79, Yerba Buena 2.4% below on 53, Mission Bay exactly at asking on 53. In an issue about where the overbidding is, the corridor is where it is not. | Buyer opening holds, and this issue measures exactly how wide it is. |
| #16 | Aug 6, 2026 | Flat in every window, which this issue argues is the whole point. South Beach condos read 100.0% of asking at 30, 90 and 180 days and 99.0% over the trailing year. South of Market reads 99.4, 99.8, 99.6 and 99.0. Four windows, one answer. Every house lane in this issue moved when the window moved; the corridor did not, and a segment that reads the same no matter how you slice it is a segment that is not turning. | Buyer opening holds, and now it is measured four ways instead of one. |
| #15 | Aug 2, 2026 | Unchanged at the bottom of the same ladder. This issue extended the over-asking gradient into small multifamily, and the corridor still anchors the low end: right at asking, while two-unit buildings cleared 11.7% over and houses 23.8%. The ordering is by how much a property lives like a house, and a corridor tower is the furthest thing from one. | Buyer opening holds, and this issue explains why it persists. |
| #14 | Jul 29, 2026 | Read on supply this time, not price. Citywide condo and townhome months of supply fell from 3.9 to 1.7 in a year and active listings from 772 to 480, so even the calmest lane in the city now offers less to choose from. This issue did not re-measure corridor pricing. | Buyer opening holds on price; the shelf behind it is thinner. |
| #13 | Jul 25, 2026 | Graduated to the essay. Back at asking for the first time since 2022, after three springs about 1% below it, and the clock changed: median market time fell from 38 days to 19 and the share selling over asking roughly doubled, from the low twenties to the mid forties. Price at par, speed doubled. | Negotiating room intact; the window now narrows in speed, not price. |
| #12 | Jul 21, 2026 | Still the calm corner, and it proves the point. District 9 condos, SoMa, Mission Bay, and South Beach, sold right at list, about 100%, with only 31% over asking on 836 sales, while mid-priced houses cleared 123 to 127% of list. Condos rarely get listed low to start a war, so the overbid never appears. | Buyer leverage holds where the list-low tactic is not used. |
| #11 | Jul 17, 2026 | Unmoved by the house story. While overbidding ran one tier below the trophy core, the corridor and condo core cleared near asking, and the two flat lanes the field named as spillover candidates, Hayes Valley and Lower Pacific Heights, stayed calm in closed data. | Still the clearest buyer opening in the city. |
| #10 | Jul 14, 2026 | Still soft while the headline is elsewhere. June's million-over-asking story is a west-side and central house market, not the AI-corridor towers. District 9 condos, SoMa, Mission Bay and South Beach, ran about 10% below last year even as volume climbed. Activity returns to the corridor; pricing has not. | Still the clearest buyer opening in the city. |
| #09 | Jul 10, 2026 | Still the soft floor at the halfway mark. District 9 condos, SoMa, Mission Bay, and South Beach, sold near 100% of list with only about 36% over asking on roughly 290 sales this year, while citywide houses ran near 121% of list. The widest lane in the city stays open. | Clearest buyer opportunity holds into the second half. |
| #08 | Jul 5, 2026 | Still the soft floor even as the top books records. District 9 condos, SoMa, Mission Bay, and South Beach, sold near 100% of list with heavy cash and light competition, while $5M+ houses set a decade volume record at about 112% of list on roughly 64% cash. Cash without a crowd here. | Buyer opportunity intact where the crowds are not. |
| #06 | Jun 25, 2026 | Still the calm corner while the house middle runs hot. District 9 condos, SoMa, Mission Bay, and South Beach, sold right at list, about 100%, with only 35% over asking on 300 sales, against the $1.5M to $3M house band at 122 to 125% of list. | Buyer opportunity holds where the bidding wars are not. |
| #05 | Jun 21, 2026 | Cash, not heat. Corridor condos carry heavier cash than the citywide condo average, about 42% versus 37%, yet still sell near 98.7% of list with only about 20% over asking versus 45% citywide. Cash concentrates here; competition does not. | Negotiating room for financed buyers. |
| #04 | Jun 17, 2026 | Still the soft floor while houses raced ahead. Corridor near 98 to 99% of list versus 103.8% citywide and about 123% for single-family in the last 30 days. | Buyer opportunity holds; the gap to houses only widened. |
| #03 | Jun 13, 2026 | Still the bottom of the overbid table. Corridor sale-to-list at about 98 to 99% versus 103.6% citywide, trailing year. | Opportunity intact for negotiators. |
| #02 | Jun 10, 2026 | Turning at the edges. Citywide condos hit 101.4% of list in May; inventory fell to 584 from 905. The corridor towers remain the soft end. | Window narrowing, not closed. |
| #01 | Jun 7, 2026 | Soft. Only 37 to 43% of SoMa, Mission Bay, and downtown condos sold over asking. | Clearest buyer opportunity in the city. |
- TICs turned in one year: from a median at asking in 37 days to +5.8% over asking in 16 days, on 176 sales against 169 the year before. The share clearing 10% or more over asking nearly tripled, 13.6% to 39.8%, and now beats condos at 29.6%. And the speed has no precedent: in ten years of data, no year posted a median under 29 days.
- The product is the original low-dues flat: median year built 1909 against 1989 for condos, median reported dues $450 against $823, and a median $986 per square foot against $1,101, a 10.4% discount for a similar-sized home.
- The cash-only folklore is out of date: of TIC sales with reported financing, 24.7% were cash, a lower cash share than condos at 37.0%, and half closed with conventional loans. Fractional TIC financing exists; the terms differ from condo loans, so talk to a TIC-experienced lender early.
- Geography inverts the condo map: TIC heat is in Districts 6, 7 and 1 (the Marina ran +17.8% on a Directional 9 sales), while District 5, the TIC volume center, sat at +3.2%, and Noe Valley TICs closed at asking on 19 sales while Noe condos ran +16.6%.
- This is a stable niche, not a fad or a fade: 232 to 326 TIC sales a year every year since 2016 outside the 2021 spike, and 2026 is pacing at the top of that range. It remains the city's discount door into the neighborhoods buyers actually want.
Sale-to-list, market time and inventory for every San Francisco neighborhood are live in the market explorer, each with its reliability label. If a TIC listing has caught your eye, read its subdistrict there first, then assemble the right team before you write.
Methodology and sources
Source: POTM Command, governed MLS analytics, queried August 30, 2026. All current figures cover closed sales from March 3 through August 29, 2026; year-ago figures use the identical window in 2025. Counts: 176 TIC sales now, 169 a year ago, 1,364 condo and townhouse sales now. Every figure is an exact median, never an average. Sale-to-list is the ratio of sold price to final list price. Dues are reported on 144 of the 176 TIC sales and financing on 158; both shares use the reported denominator only, and unreported sales are never assumed. The decade table and chart compare January 1 through August 29 of each year, 2016 through 2026, so the year-to-date figures (2026 at +2.9% over asking) sit beside the trailing six-month figures (+5.8%) without contradiction; annual year-to-date samples run 139 to 294 sales. District figures at 13 or more sales meet at least the Directional reliability threshold for this window; the Marina (9 sales) and North Panhandle (5) are labeled in the text and read accordingly. Houses and 2-4 unit buildings are excluded throughout. General information, not legal, lending or tax advice: TIC ownership and financing have real legal and lending differences from condominiums, and the right professionals for those questions are a TIC-experienced attorney and lender.
What does this Pulse mean for your block?
Two homes five blocks apart can carry very different risk. Let's talk about your specific segment, no pressure.