
POTM Blog Issue #20, August 25, 2026
The HOA Line
Every report this year says the same thing: houses are hot, condos are not. True, and close to useless, because “condo” is not one market. It is two, and the line between them is not the neighborhood, not the year the building went up, and not parking. It is the monthly HOA dues.
By Paulo Serna, San Francisco Real Estate Agent, Compass | Level Up Group · CA DRE# 02150409 · Published August 25, 2026
Data source Paulo’s Pulse, governed SFAR MLS data
Every market report this year has told you the same thing. Houses are hot, condos are not.
It is true. Over the last six months, San Francisco single-family homes sold at a median of +22.5% over asking. Condos sold at +1.3%. That is 1,276 houses against 1,375 condos. It is not close.
It is also close to useless, because "condo" is not one market. It is two, and the line between them is not the neighborhood, not the year the building went up, and not whether it has parking. It is the monthly HOA dues.
One number sorts the whole market
Take every condo that closed in San Francisco over the last six months and sort it into three groups by monthly homeowners association dues. Then ask one question of each group: what share of sales cleared the asking price by 10% or more?
Under $500 a month: 59.9% of sales. Between $500 and $1,000: 26.0%. Over $1,000: 11.1%. The share roughly halves at each step. Under $500, three sales in five end in a double-digit overbid, in a median 13 days. Over $1,000, one in nine.
The other end of the distribution says it just as plainly. In the over $1,000 group, the single most common outcome is still closing below asking: 39.9% of those sales did, against 38.9% over and 21.2% right at it, on a median 19 days. Above that line on the dues sheet, negotiating down is not the exception. It is the default.
The full four-bracket detail is in the By the numbers table below, and it behaves: the brackets are cuts of a continuous slope, not real categories. Draw the lines at $500 and $1,000, or at $800 and $1,200, and the overbid share never breaks order: more dues, fewer bidding wars, and a market that slows from 13 days at the bottom of the ladder to about three weeks at the top. When a pattern survives every way of slicing it, it is the pattern doing the talking, not the slicing.
One more observation, worth a sentence but only a sentence. The discount you might expect on high dues buildings does not clearly show up in price per square foot, which lands close to the low dues group at both ends of the range. Different buildings in different neighborhoods make that a rough comparison, so I read it as suggestive rather than proven.
Where it shows up on the map
You have heard that older buildings do better. That is true, and it is mostly this: pre-1940 condos sold at +10.7% over asking these six months while buildings from 2015 or later sold at asking. You have heard that some neighborhoods are stronger. Also true, also mostly this, because neighborhoods sort themselves by building type. Flats carved out of Victorians and Edwardians cluster in the house districts. Towers cluster downtown and along the waterfront.
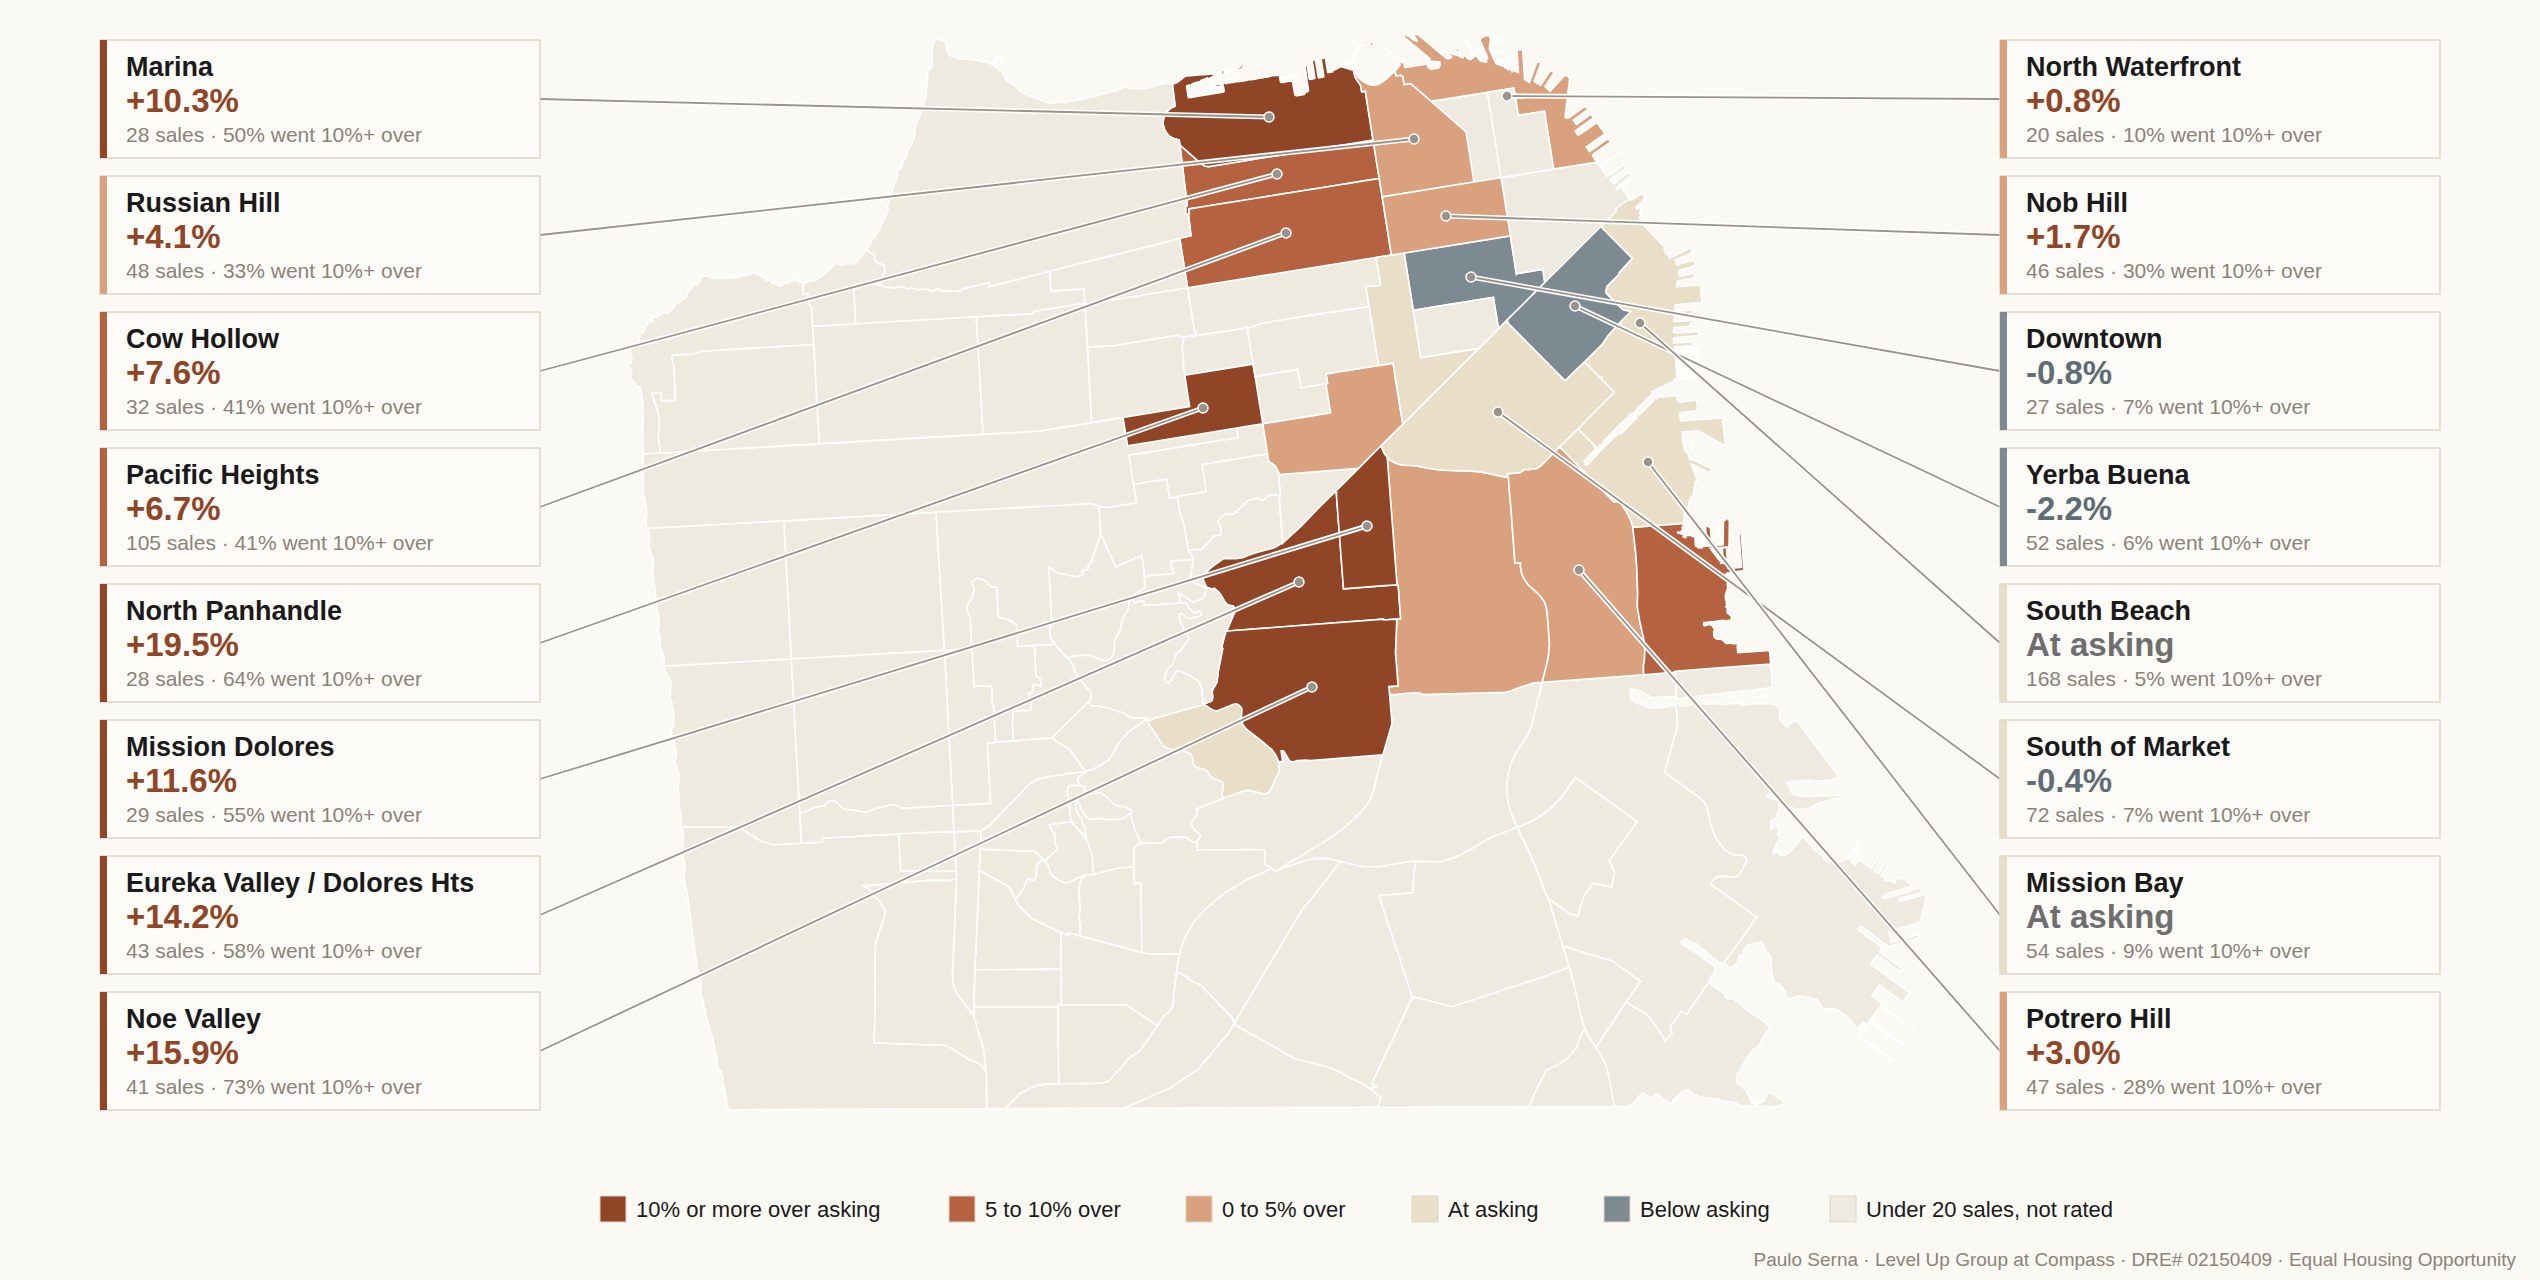
North Panhandle leads the city at +19.5% over asking, with Noe Valley at +15.9%, Eureka Valley at +14.2% and Mission Dolores at +11.6%. In Noe Valley, 92.7% of condo sales cleared asking, the highest share among neighborhoods with 20 or more sales. At the other end, Yerba Buena, Downtown and SoMa sit below asking and South Beach, Mission Bay and Van Ness right at it, with the below-asking corridor taking a month or more to sell, the same corridor where Issue #19 found cash buyers negotiating real discounts. South Beach by itself carries 168 sales, as many as the five strongest neighborhoods combined, which is a large part of why the citywide condo number looks the way it does. And the Marina is no longer in between: +10.3% over asking these six months, with Pacific Heights at +6.7%, as the pre-war flat side of those mixed streets does the selling. Among Marina, Pacific Heights and Cow Hollow 1 and 2 bedroom condos, 40.4% of sales cleared asking by double digits, in a median 9 days. Cole Valley, Corona Heights, Inner Richmond and Bernal Heights are running hot as well, but on fewer than 20 sales each this half, so the map shows them unrated.
All of it describes the same thing from different angles. A flat carved out of a 1926 four-unit Victorian has almost no dues, because there is no elevator, no lobby, no doorman, no gym. A 2015 tower has $1,200 a month, and it has them forever, and they rise. A buyer with a fixed monthly budget feels that immediately: the dues come out of the same pocket as the mortgage payment, and lenders count them the same way, as the CFPB's plain-language explainer lays out. The building with low dues does not just cost less to own. It has a materially larger pool of buyers who can afford to bid on it.
Two sales that beat their own bracket
Both of these sold this cycle. Both sit in the middle dues bracket, the $500 to $800 group where the median sale closes just over asking and about three in ten clear double digits over. Neither of them behaved like it.
7 Casa Way, Unit 1, in the Marina. A one bedroom, one bath in a 1926 building, dues of $626. Listed at $929,000, it closed August 19 at $1,260,000, which is +35.6% over asking in 12 days. Not a one-off: Unit 5 in the same building sold for $1,600,000 on a $1,195,000 ask in July 2024, also in 12 days.
1945 Washington Street, Unit 204, in Pacific Heights. A two bedroom, two bath with parking, dues of about $797, listed at $1,095,000. It drew 12 offers and is in contract above $1.4M. It was still pending as this issue went to press, so the exact price is not yet a matter of record; I will update it when the sale records. And note the year on the building: 1987. Not a pre-war conversion.
This is the part I want to be careful about, because it would be easy to use these two sales dishonestly. They are not proof that low dues win. They are the opposite: two homes in the ordinary middle of the dues range that blew straight through what their bracket predicted, one of them in a 1987 building. The bracket sets the odds. In the $500 to $800 group, roughly three sales in ten clear double digits over asking. Both of these were among them. A buyer who reads "condos are flat" and offers accordingly on a home like either of these does not lose by a little.
What the strong ones have in common
Low dues get a home into the running. What wins it is whether the home lives like a home rather than a room with a view.
Real square footage instead of a clever floor plan. Light from more than one side. Parking, though it matters less than the folklore says: units with parking cleared double digits over asking 30.6% of the time against 23.3% without. A second bedroom a person could actually sleep in. Outdoor space, or a view that does not depend on a neighbor's roofline.
The bedroom count says the same thing plainly. Not one of 45 studio sales cleared double digits, and studios sat a median 26 days. One bedrooms, 13.0% and 22 days. Two bedrooms, 31.5% and 14 days. Three bedrooms, 48.2% and 13 days. The closer a condo gets to functioning like a house, the more it behaves like one.
My read
If you are shopping for a condo, pull the dues before you fall in love with the kitchen.
Not because high dues are a bad deal. Sometimes the elevator, the desk and the roof deck are exactly what you want, and that building will be a calmer purchase with room to negotiate. That is a real advantage if you value it honestly.
Pull them because the dues tell you which negotiation you are walking into. Under $500 a month, assume competition and be ready. Over $1,200, assume you have time, and use it. The mistake I watch buyers make is bringing one plan to both rooms: they read that condos are flat, offer near asking on the best low-dues flat they have seen all year, and lose it to someone who understood the room. The next comparable one shows up four months later and costs more.
And if you are selling in a high-dues building, this is the number to get ahead of. A clean, current reserve study, which California law requires at least every three years, and a plain explanation of what the dues actually buy will do more for your result than another week of staging.
By the numbers
| Monthly HOA dues | Sales | Median vs asking | Median days on market | Went 10%+ over | Median $ per sq ft |
|---|---|---|---|---|---|
| Under $500 | 302 | +13.0% | 13 | 59.9% | $1,184 |
| $500 to $800 | 335 | +1.8% | 16 | 31.0% | $1,021 |
| $800 to $1,200 | 342 | At asking | 20 | 17.3% | $1,003 |
| $1,200 and up | 342 | At asking | 18 | 9.1% | $1,187 |
AI Corridor Scoreboard
One reading per issue on the city's softest segment, the condos near the new AI offices, so you can watch the turn as it happens.
| Issue | Date | Reading | Call |
|---|---|---|---|
| #20 (this issue) | Aug 25, 2026 | Two markets, one label. Corridor towers still at or below asking over the past six months (South Beach at asking on 168 sales, Yerba Buena -2.2%) while low-dues flats citywide cleared 10%+ over in 59.9% of sales. | Check the dues before you plan the offer. |
| #19 | Aug 18, 2026 | Where cash buys the most and shouts the least. Corridor condos ran 41.7% cash in the past 12 months, the heaviest concentration this series tracks, yet cash and financed closed at the same price, 99.2% versus 99.3% of asking. Cash's whole edge here is the clock: 20 median days on market against 39 financed. | Financed buyers give up nothing on price here; they pay in patience. |
Show the 16 earlier readings
| Issue | Date | Reading | Call |
|---|---|---|---|
| #17 | Aug 9, 2026 | Zero, which is the cleanest reading this scoreboard has produced. Across 368 corridor condo closings so far in 2026, not one sold $1,000,000 over asking, and the typical one closed slightly under asking: South Beach 0.7% below on 183 sales, South of Market 1.0% below on 79, Yerba Buena 2.4% below on 53, Mission Bay exactly at asking on 53. In an issue about where the overbidding is, the corridor is where it is not. | Buyer opening holds, and this issue measures exactly how wide it is. |
| #16 | Aug 6, 2026 | Flat in every window, which this issue argues is the whole point. South Beach condos read 100.0% of asking at 30, 90 and 180 days and 99.0% over the trailing year. South of Market reads 99.4, 99.8, 99.6 and 99.0. Four windows, one answer. Every house lane in this issue moved when the window moved; the corridor did not, and a segment that reads the same no matter how you slice it is a segment that is not turning. | Buyer opening holds, and now it is measured four ways instead of one. |
| #15 | Aug 2, 2026 | Unchanged at the bottom of the same ladder. This issue extended the over-asking gradient into small multifamily, and the corridor still anchors the low end: right at asking, while two-unit buildings cleared 11.7% over and houses 23.8%. The ordering is by how much a property lives like a house, and a corridor tower is the furthest thing from one. | Buyer opening holds, and this issue explains why it persists. |
| #14 | Jul 29, 2026 | Read on supply this time, not price. Citywide condo and townhome months of supply fell from 3.9 to 1.7 in a year and active listings from 772 to 480, so even the calmest lane in the city now offers less to choose from. This issue did not re-measure corridor pricing. | Buyer opening holds on price; the shelf behind it is thinner. |
| #13 | Jul 25, 2026 | Graduated to the essay. Back at asking for the first time since 2022, after three springs about 1% below it, and the clock changed: median market time fell from 38 days to 19 and the share selling over asking roughly doubled, from the low twenties to the mid forties. Price at par, speed doubled. | Negotiating room intact; the window now narrows in speed, not price. |
| #12 | Jul 21, 2026 | Still the calm corner, and it proves the point. District 9 condos, SoMa, Mission Bay, and South Beach, sold right at list, about 100%, with only 31% over asking on 836 sales, while mid-priced houses cleared 123 to 127% of list. Condos rarely get listed low to start a war, so the overbid never appears. | Buyer leverage holds where the list-low tactic is not used. |
| #11 | Jul 17, 2026 | Unmoved by the house story. While overbidding ran one tier below the trophy core, the corridor and condo core cleared near asking, and the two flat lanes the field named as spillover candidates, Hayes Valley and Lower Pacific Heights, stayed calm in closed data. | Still the clearest buyer opening in the city. |
| #10 | Jul 14, 2026 | Still soft while the headline is elsewhere. June's million-over-asking story is a west-side and central house market, not the AI-corridor towers. District 9 condos, SoMa, Mission Bay and South Beach, ran about 10% below last year even as volume climbed. Activity returns to the corridor; pricing has not. | Still the clearest buyer opening in the city. |
| #09 | Jul 10, 2026 | Still the soft floor at the halfway mark. District 9 condos, SoMa, Mission Bay, and South Beach, sold near 100% of list with only about 36% over asking on roughly 290 sales this year, while citywide houses ran near 121% of list. The widest lane in the city stays open. | Clearest buyer opportunity holds into the second half. |
| #08 | Jul 5, 2026 | Still the soft floor even as the top books records. District 9 condos, SoMa, Mission Bay, and South Beach, sold near 100% of list with heavy cash and light competition, while $5M+ houses set a decade volume record at about 112% of list on roughly 64% cash. Cash without a crowd here. | Buyer opportunity intact where the crowds are not. |
| #06 | Jun 25, 2026 | Still the calm corner while the house middle runs hot. District 9 condos, SoMa, Mission Bay, and South Beach, sold right at list, about 100%, with only 35% over asking on 300 sales, against the $1.5M to $3M house band at 122 to 125% of list. | Buyer opportunity holds where the bidding wars are not. |
| #05 | Jun 21, 2026 | Cash, not heat. Corridor condos carry heavier cash than the citywide condo average, about 42% versus 37%, yet still sell near 98.7% of list with only about 20% over asking versus 45% citywide. Cash concentrates here; competition does not. | Negotiating room for financed buyers. |
| #04 | Jun 17, 2026 | Still the soft floor while houses raced ahead. Corridor near 98 to 99% of list versus 103.8% citywide and about 123% for single-family in the last 30 days. | Buyer opportunity holds; the gap to houses only widened. |
| #03 | Jun 13, 2026 | Still the bottom of the overbid table. Corridor sale-to-list at about 98 to 99% versus 103.6% citywide, trailing year. | Opportunity intact for negotiators. |
| #02 | Jun 10, 2026 | Turning at the edges. Citywide condos hit 101.4% of list in May; inventory fell to 584 from 905. The corridor towers remain the soft end. | Window narrowing, not closed. |
| #01 | Jun 7, 2026 | Soft. Only 37 to 43% of SoMa, Mission Bay, and downtown condos sold over asking. | Clearest buyer opportunity in the city. |
- The dues ladder is the cleanest gradient in the condo market: the share of sales clearing 10% or more over asking runs 59.9% under $500 a month, 26.0% between $500 and $1,000, and 11.1% above $1,000. Draw the bracket lines anywhere and the order never changes.
- Above $1,000 a month the script still flips: closing below asking is the most common outcome, 39.9% of sales, on a median 19 days. Below $500, the market moves in 13 days and three in five sales end in a double-digit overbid.
- The old explanations are mostly this one. Pre-1940 condos beat 2015-and-newer, and house-district flats beat tower districts, largely because a flat carved out of a Victorian carries almost no dues while a tower carries $1,200 a month, forever, and rising.
- The bracket is not destiny. A 1926 Marina one bedroom closed 35.6% over asking in 12 days, and a 1987 Pacific Heights two bedroom drew 12 offers, both from the middle dues bracket where the median sale closes just over asking. Low dues get a home into the running; whether it lives like a home decides the bidding.
Sale-to-list, market time and inventory for every San Francisco neighborhood are live in the market explorer, each with its reliability label. Pull your building’s dues, then read your own subdistrict before you write the offer.
Methodology and sources
Source: POTM Command, governed MLS analytics, closed sales through August 21, 2026. Condo figures cover 1,375 closed condo and townhouse sales over the trailing six months, of which 1,321 reported HOA dues; the citywide house and condo comparison uses the same six months, 1,276 houses and 1,375 condos. Every figure is an exact median, never an average and never an approximation. Dues brackets are cuts of a continuous relationship, not categories; the ladder holds under any bracketing, which is why the shares lead this issue rather than the medians. Neighborhood figures use the same six months and are rated only at 20 or more sales; Cole Valley, Corona Heights, Inner Richmond and Bernal Heights fell under that floor this half and are shown unrated on the map. 1945 Washington Street was in contract and had not recorded as of publication; its figure is described in general terms and will be updated when it records. Everything here is observed, not causal. Updated August 25, 2026: every figure refreshed from the launch twelve-month window to the trailing six months.
What does this Pulse mean for your block?
Two homes five blocks apart can carry very different risk. Let's talk about your specific segment, no pressure.