
POTM Blog Issue #11, July 17, 2026
After the Overbid
Issue #10 took June's million-over headline apart: real, narrow, three districts, cash, priced in. This issue asks the more useful question: what do buyers do after losing to that market five times? They do not leave. They adapt. Here is where that adaptation already shows up in the data, where it does not yet, and what "spillover" honestly means.
By Paulo Serna, San Francisco Real Estate Agent, Compass | Level Up Group · CA DRE# 02150409 · Published July 17, 2026
- What changed: the overbid story now runs one price tier below the trophy core. Sunset and Parkside houses cleared a median 146.8% of list on a strong 50-sale sample.
- Who this affects: buyers priced out of Noe Valley and the Richmonds, and sellers in the substitute house lanes they move to.
- Buyer takeaway: budget from closed prices in your substitute lane, not list prices. The discount for leaving the trophy core is shrinking.
- Seller takeaway: substitute-lane sellers are seeing prestige-level competition at half the price point. Pricing to invite it is what produces it.
Data through July 16, 2026 (ten-year series) and the June 2 to July 11 sold window.
A buyer who has lost five bidding wars in Noe Valley does not usually quit. They change what they bid on. That single behavior, repeated across hundreds of households, is the most important thing happening in the San Francisco house market right now, and it is also the hardest thing to see in the MLS. So this issue keeps two columns strictly apart: what the data measures, and what the field observes. Every claim below is stamped one or the other.
The measured fact, briefly
The extreme overbids are real and narrow. June's 45 million-over closings were 80% single-family houses, and 36 of the 45 sat in just three districts: the Noe-to-Haight spine, the Richmond, and Pacific Heights with the Marina. The group cleared a median 144% of list, 54% of it cash, and the percentage was amplified by list-low pricing. That was Issue #10. It is the snapshot. What follows is the film.
The trophy core, houses, 2026
124%
of list, $3.20M median
Noe Valley + the central Richmonds; 46% cash
The substitute lanes, houses, 2026
131%
of list, $1.95M median
Sunset/Parkside + Glen Park, Bernal, Outer Richmond; 31% cash
The behavior: buyers adapt, they do not leave
Call it what it is: buyer adaptation. After enough losses in the trophy lanes, buyers make three moves, usually in this order. They stretch the budget once, and only once. They broaden geography, trading the dream block for the same house type two districts west or south. And they redefine priorities: garage over view, sun over walkability, done-enough over done. None of this is speculation; it is what agents watch clients do every month. But be precise about the evidence: this is observed behavior, told to us by the field, not a column in the MLS.
The strategy: think in neighborhood types, not names
The practical version of adaptation is substitution. A buyer who wanted a Noe Valley house is not actually shopping a neighborhood; they are shopping a type: a detached house with light, a yard, and a commute they can live with. Several lanes sell that type at a lower entry: the Sunset and Parkside, Glen Park, Bernal Heights, the Outer Richmond. A Pacific Heights condo buyer has a different substitution map than a house buyer. The map below is how I group the city for this purpose, built from a decade of closed sales.
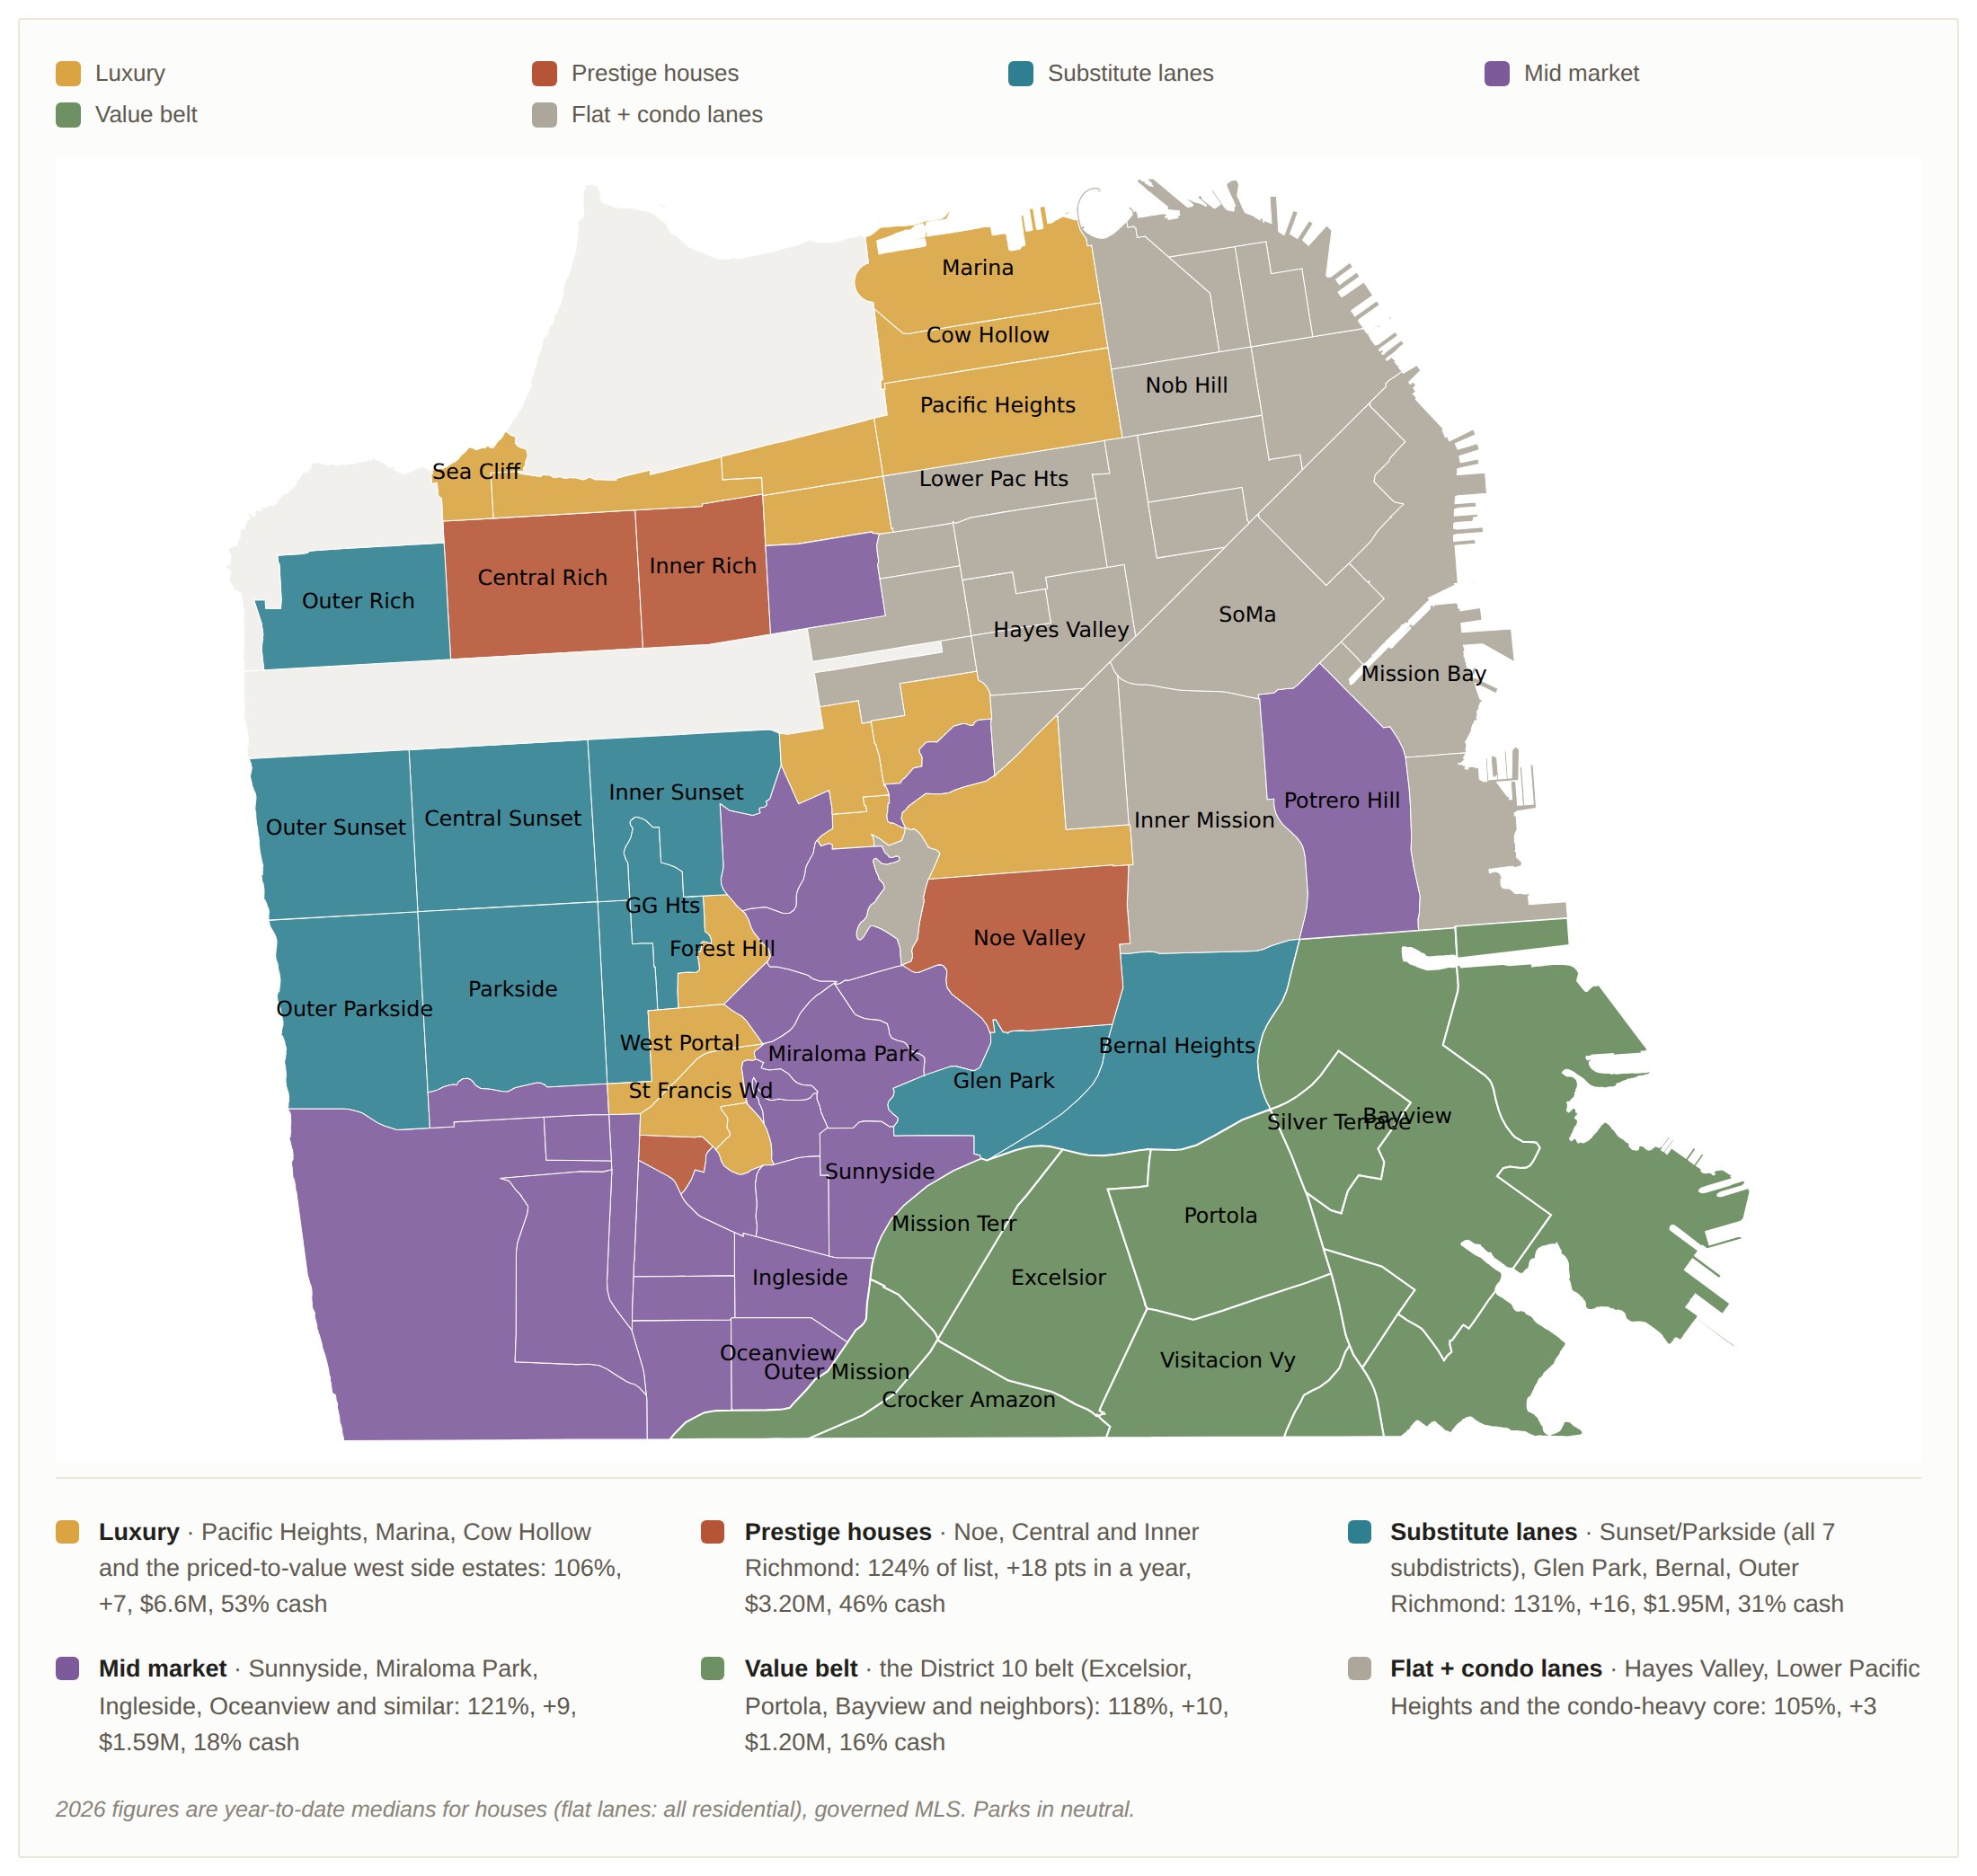
"Spillover," defined and stamped
Spillover is the claim that demand squeezed out of the trophy lanes re-appears as measurable pressure in the substitute lanes. It is a precise, useful word, and it is exactly where market commentary gets ahead of its data. So here is the stamp this issue applies every time: spillover in San Francisco is observed, not yet broadly measured. Agents see the priced-out Noe buyer at the Sunset open house. The MLS cannot yet distinguish that buyer from one who always wanted the Sunset. When I draw that connection, it is a dotted line labeled "observed buyer interest," never a solid arrow labeled "demand moved here."
What the data already shows
One place has graduated from dotted line to measured fact: District 2, the Sunset and Parkside. In the roughly 40-day window through July 11, houses there cleared a median 146.8% of list on 50 sales: 96% sold over asking, three quarters cleared 120% or more, and the median sale took 11 days. The middle of the distribution runs 120% to 156%. That is not a thin-sample curiosity; it is the strongest competitive reading in the city, at a $1.95M median, in exactly the affordable house district a priced-out Noe or Richmond buyer moves to.
Be honest about its composition: part of that 146.8% is the same list-low tactic Issue #10 documented, running hardest at mid price. But 96% over asking in 11 days on a strong sample is real competition, whatever the listing strategy. Around it, the picture is graded. Glen Park, adjacent to Noe, reads 120.3% on a small sample with 3 actives against 12 pendings: directional, tight, fast. And two neighborhoods the field named as spillover candidates, Hayes Valley and Lower Pacific Heights, do not show it in closed data: their samples are thin and their condo-heavy lanes cleared near 106% to 114%. The field was half right, and the data tells us which half.
The ten-year check: what a decade says about spillover
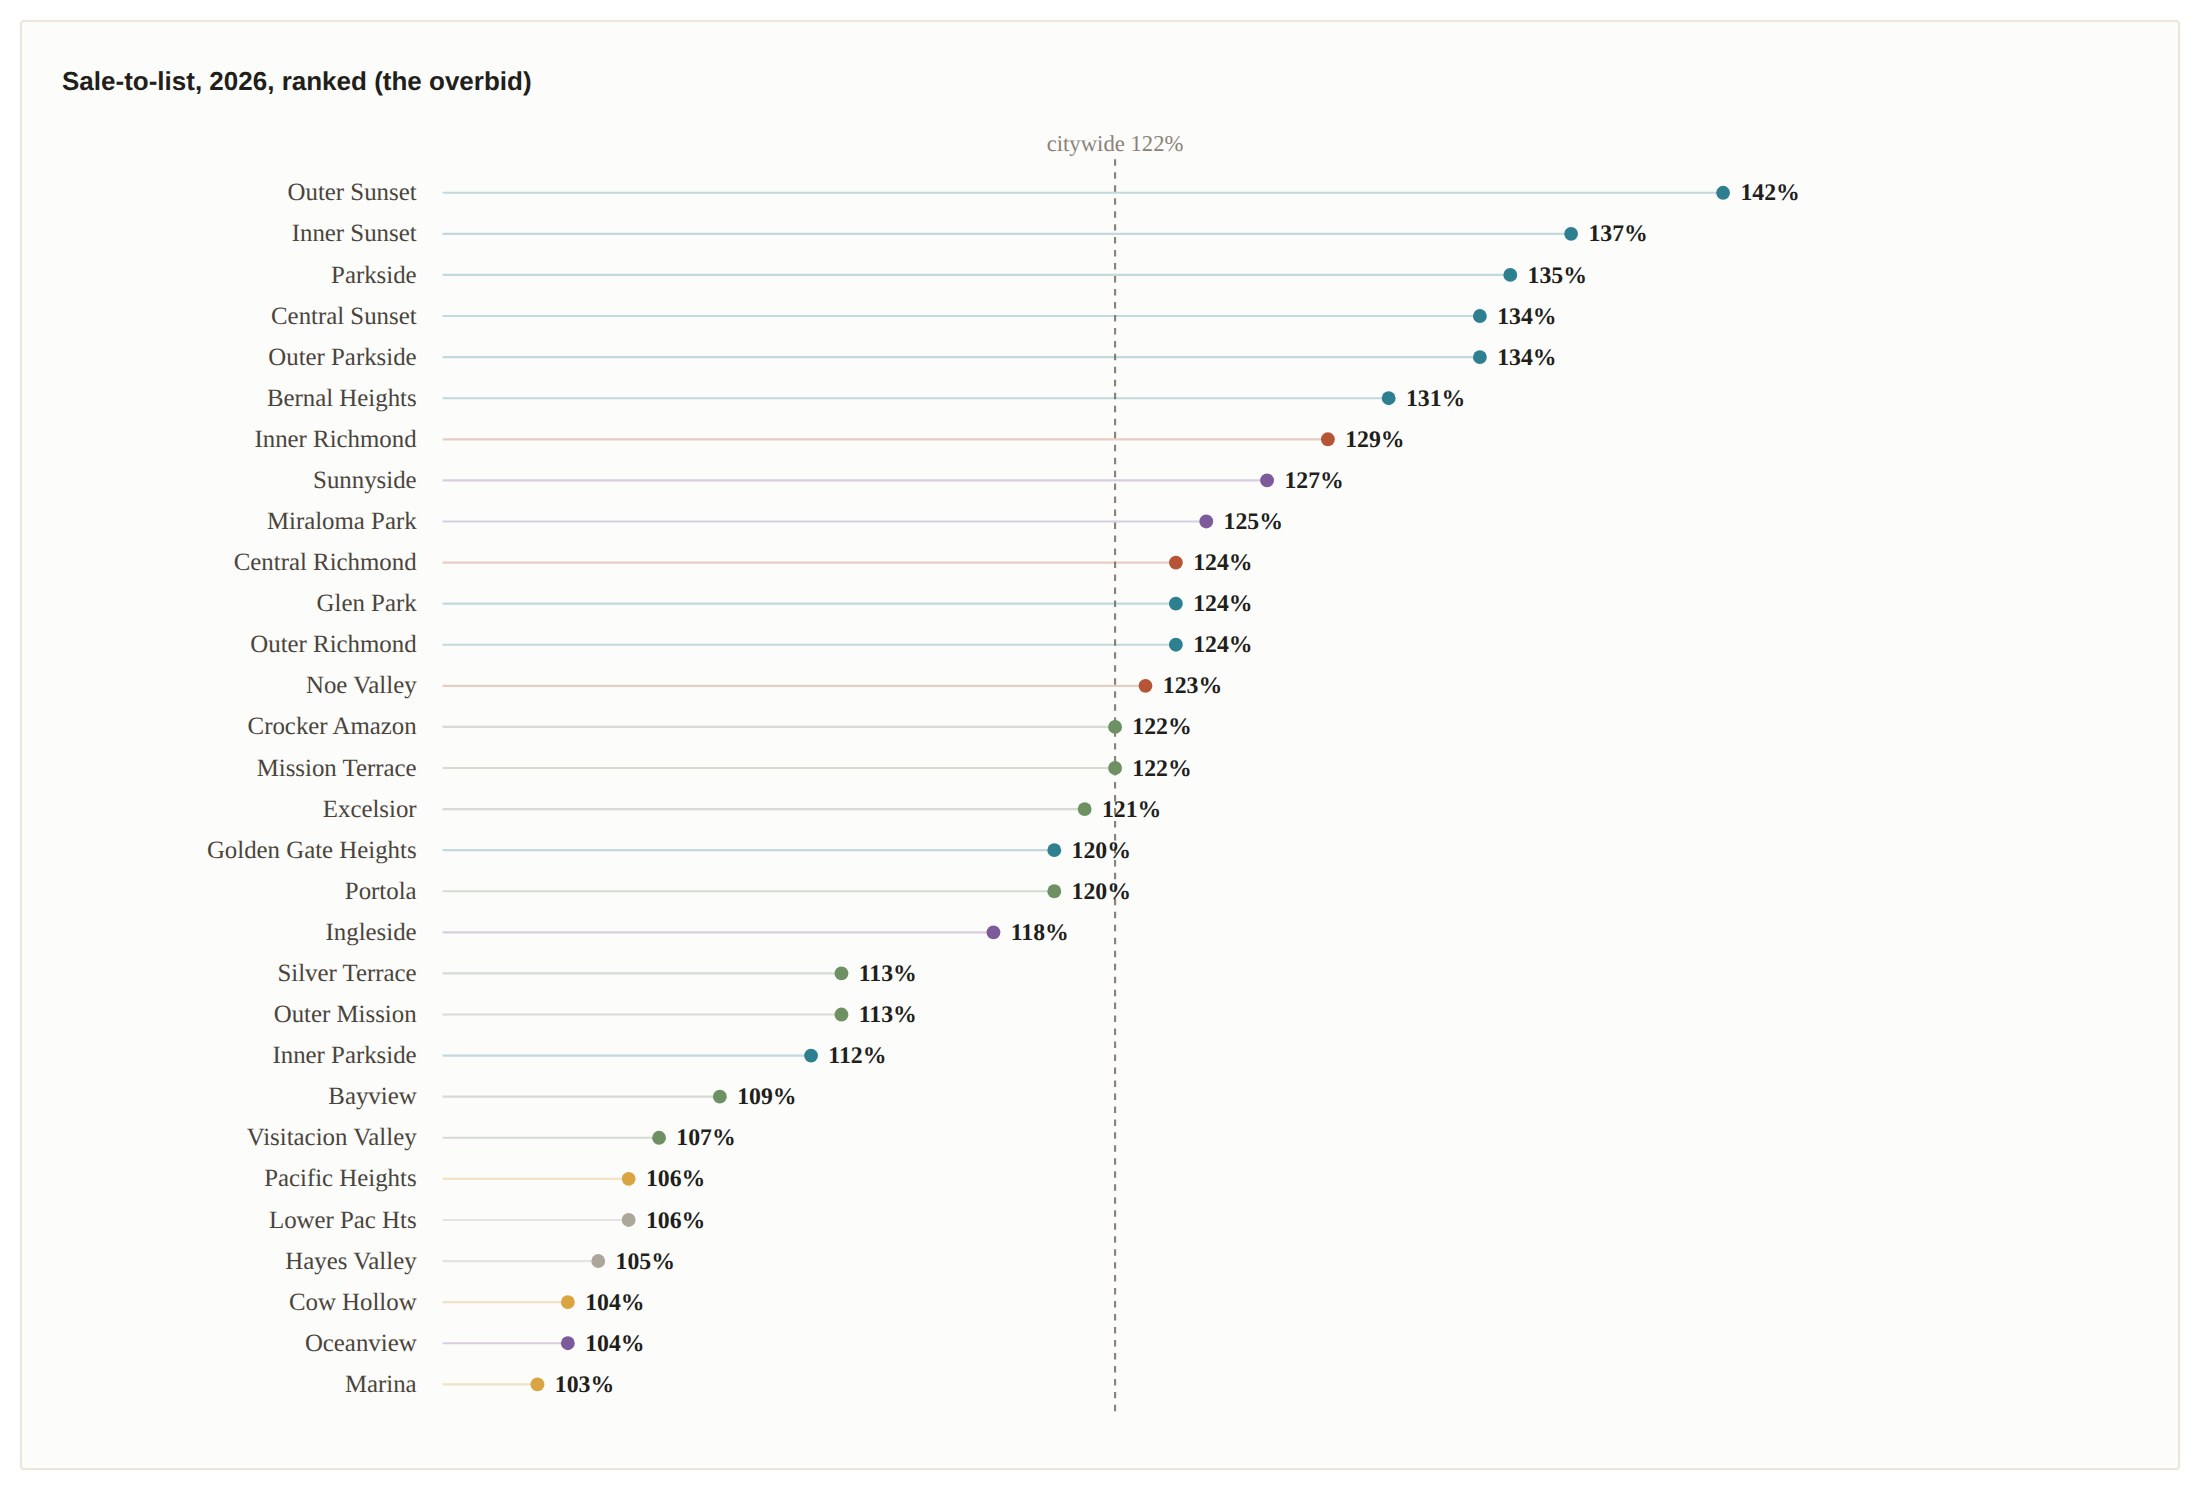
If spillover were driving 2026, the substitute lanes would be accelerating ahead of the trophy lanes. They are not. I rebuilt the full decade, 63,781 closed sales from 2016 through this month, grouped by the map above, and ran the season-matched test: January through mid-July 2026 versus the same window of 2025. Every house lane jumped, and the prestige core jumped hardest.
Three more decade facts keep the story honest. First, the substitute lanes have posted the highest sale-to-list in the city in every year of the decade; list-low pricing at a mid price point is a longstanding structure there, not a 2026 arrival. Second, the money is different: Pacific Heights houses ran 62% cash this year and Noe 52%, while Glen Park ran 13% and the Excelsior and Portola about 18%. The substitute lanes are financed conventionally, by a different cohort than the cash-rich trophy buyers. Third, over the full ten years the affordability ladder compressed from the bottom up: Ingleside appreciated about 75% and Central Richmond about 70%, against 33% for Pacific Heights and 62% citywide. On the decade horizon, the cheaper house lanes have already done the most catching up.
Every neighborhood, at a glance: the ten-year table
The sparkline carries the shape of the last ten years in the width of a word; the endpoints carry the numbers. Read the level, not the wiggle; single-year counts are small.
| Neighborhood | Ten-year path | 2016 | 2026 | Change points, ’16→’26 | |
|---|---|---|---|---|---|
| Outer Sunset | 116% | 142% | +26 pts | ||
| Inner Sunset | 116% | 137% | +21 pts | ||
| Parkside | 117% | 135% | +18 pts | ||
| Central Sunset | 117% | 134% | +17 pts | ||
| Outer Parkside | 118% | 134% | +16 pts | ||
| Bernal Heights | 114% | 131% | +17 pts | ||
| Inner Richmond | 110% | 129% | +19 pts | ||
| Sunnyside | 112% | 127% | +15 pts | ||
| Miraloma Park | 110% | 125% | +15 pts | ||
| Central Richmond | 109% | 124% | +15 pts | ||
| Glen Park | 109% | 124% | +15 pts | ||
| Outer Richmond | 111% | 124% | +13 pts | ||
| Noe Valley | 104% | 123% | +19 pts | ||
| Crocker Amazon | 104% | 122% | +18 pts | ||
| Mission Terrace | 108% | 122% | +14 pts | ||
| Excelsior | 113% | 121% | +8 pts | ||
| Golden Gate Heights | 107% | 120% | +13 pts | ||
| Portola | 107% | 120% | +13 pts | ||
| Ingleside | 109% | 118% | +9 pts | ||
| Silver Terrace | 108% | 113% | +5 pts | ||
| Outer Mission | 105% | 113% | +8 pts | ||
| Inner Parkside | 114% | 112% | -2 pts | ||
| Bayview | 108% | 109% | +1 pts | ||
| Visitacion Valley | 112% | 107% | -5 pts | ||
| Pacific Heights | 101% | 106% | +5 pts | ||
| Lower Pac Hts | 100% | 106% | +6 pts | ||
| Hayes Valley | 101% | 105% | +4 pts | ||
| Cow Hollow | 97% | 104% | +7 pts | ||
| Oceanview | 107% | 104% | -3 pts | ||
| Marina | 98% | 103% | +5 pts | ||
| Citywide | 109% | 122% |
What this means for buyers
If you are shopping the substitute lanes, budget from closed prices, not list prices; in the Sunset and Parkside the median house cleared 47 points over list. Ask your agent for the sale-to-list history on the specific block, decide your number before offer day, and remember what the map says about type: the same money buys a different, calmer process one group over. The value belt and the mid market lanes overbid least among the house groups, carry the city's largest active house inventory, and financed buyers are the norm there, not the exception.
What this means for sellers
If you own a house in a substitute lane, this is the strongest seller's setup in the city: prestige-level competition without a prestige price of entry. But the 146% headline is produced by pricing that invites competition, not by wishing. Priced at the number you hope to get, the same house sits. And if you own in the flat lanes, price to your own lane's data; borrowing heat from the house market is how condo listings go stale.
The leading indicators I am watching
Six signals would upgrade spillover from observed to measured, and none of them is a headline: year-over-year sale-to-list in the substitute lanes rising faster than the prestige core; pending-to-active ratios tightening there first; days on market compressing while the trophy lanes hold; offer counts and disclosure downloads shifting (field and CRM data, tracked deliberately); the cash share creeping up in financed lanes; and the list-low spread widening beyond its decade norm. I will keep running this test each cycle and reporting it either way.
The agent's advantage
Anyone can quote the 146%. The advantage is knowing which part of it is pricing tactic, which part is competition, which lanes it has not reached, and what the buyer across the table has already lost out on. Data is the floor. The read is the advantage.
AI Corridor Scoreboard
One reading per issue on the city's softest segment, the condos near the new AI offices, so you can watch the turn as it happens.
| Issue | Date | Reading | Call |
|---|---|---|---|
| #01 | Jun 7, 2026 | Soft. Only 37 to 43% of SoMa, Mission Bay, and downtown condos sold over asking. | Clearest buyer opportunity in the city. |
| #02 | Jun 10, 2026 | Turning at the edges. Citywide condos hit 101.4% of list in May; inventory fell to 584 from 905. The corridor towers remain the soft end. | Window narrowing, not closed. |
| #03 | Jun 13, 2026 | Still the bottom of the overbid table. Corridor sale-to-list at about 98 to 99% versus 103.6% citywide, trailing year. | Opportunity intact for negotiators. |
| #04 | Jun 17, 2026 | Still the soft floor while houses raced ahead. Corridor near 98 to 99% of list versus 103.8% citywide and about 123% for single-family in the last 30 days. | Buyer opportunity holds; the gap to houses only widened. |
| #05 | Jun 21, 2026 | Cash, not heat. Corridor condos carry heavier cash than the citywide condo average, about 42% versus 37%, yet still sell near 98.7% of list with only about 20% over asking versus 45% citywide. Cash concentrates here; competition does not. | Negotiating room for financed buyers. |
| #06 | Jun 25, 2026 | Still the calm corner while the house middle runs hot. District 9 condos, SoMa, Mission Bay, and South Beach, sold right at list, about 100%, with only 35% over asking on 300 sales, against the $1.5M to $3M house band at 122 to 125% of list. | Buyer opportunity holds where the bidding wars are not. |
| #08 | Jul 5, 2026 | Still the soft floor even as the top books records. District 9 condos, SoMa, Mission Bay, and South Beach, sold near 100% of list with heavy cash and light competition, while $5M+ houses set a decade volume record at about 112% of list on roughly 64% cash. Cash without a crowd here. | Buyer opportunity intact where the crowds are not. |
| #09 | Jul 10, 2026 | Still the soft floor at the halfway mark. District 9 condos, SoMa, Mission Bay, and South Beach, sold near 100% of list with only about 36% over asking on roughly 290 sales this year, while citywide houses ran near 121% of list. The widest lane in the city stays open. | Clearest buyer opportunity holds into the second half. |
| #10 | Jul 14, 2026 | Still soft while the headline is elsewhere. June's million-over-asking story is a west-side and central house market, not the AI-corridor towers. District 9 condos, SoMa, Mission Bay and South Beach, ran about 10% below last year even as volume climbed. Activity returns to the corridor; pricing has not. | Still the clearest buyer opening in the city. |
| #11 (this issue) | Jul 17, 2026 | Unmoved by the house story. While overbidding ran one tier below the trophy core, the corridor and condo core cleared near asking, and the two flat lanes the field named as spillover candidates, Hayes Valley and Lower Pacific Heights, stayed calm in closed data. | Still the clearest buyer opening in the city. |
- Extreme overbidding stays narrow and prestige-led. The 2026 surge lifted every house lane, with the trophy core in front, so spillover as migration remains observed, not proven.
- The Sunset and Parkside is the measured exception: 146.8% of list on 50 sales, 96% over asking, 11 days. Strong sample, one tier below the trophy core.
- Substitute-lane buyers finance; trophy buyers pay cash. Different cohorts, different playbooks.
- Buyers: budget from the block's closed prices and consider the calmer lanes on the map. Sellers in substitute lanes: price to invite competition. Flat lanes: price to your own data.
- The field was half right about spillover. The data says which half, and this test reruns every issue.
Explore every neighborhood, lane, and window yourself in Paulo's Pulse App.
Methodology and sources
Figures derived from the San Francisco MLS via POTM Command, the governed analytics layer. Recent windows: closed sales June 2 to July 11, 2026, single-family unless noted; sale-to-list above 200% excluded as data-entry error; small-sample neighborhoods labeled directional or thin. Decade series: MLS_EVENT_HISTORY, 63,781 closed events 2016-2026, deduplicated by listing; season-matched comparisons run January 1 to July 16 of each year. Coverage note: the ranked and ten-year views show the 30 subdistricts with enough annual single-family volume to carry a reliable decade median; the balance of the city's roughly 90 SFAR subdistricts are condo or TIC dominated, or too thin, and are held out rather than plotted at low confidence. Sale-to-list and price figures are medians of per-home values; 2026 is a partial year. The Sunset and Parkside reading is a current level with decade context, not a forecast. General information, not a forecast or individual advice; Paulo does not provide legal, tax, or lending advice.
What does this Pulse mean for your block?
Two homes five blocks apart can carry very different risk. Let's talk about your specific segment, no pressure.