
POTM Blog Issue #16, August 6, 2026
A Window Is a Memory
Bernal Heights houses sold at 135, 133, 131 and 123 percent of asking. Same neighborhood, same day, same governed data. The only thing that changed was how far back we looked. Every one of those numbers is correct, which is exactly the problem, and once you see why, the disagreement stops being noise and starts being the most useful signal in the report.
By Paulo Serna, San Francisco Real Estate Agent, Compass | Level Up Group · CA DRE# 02150409 · Published August 6, 2026
Data source Paulo’s Pulse, governed SFAR MLS data
On August 6 I asked our data one question four times: what are houses in Bernal Heights selling for, relative to what they asked?
The answers were 135.0%, 132.9%, 131.1% and 123.2% of asking. Every one of them is correct. None is a rounding difference, a definition trick, or a different data source. Same neighborhood, same property type, same governed dataset, same afternoon. The only variable is how far back the window reaches.
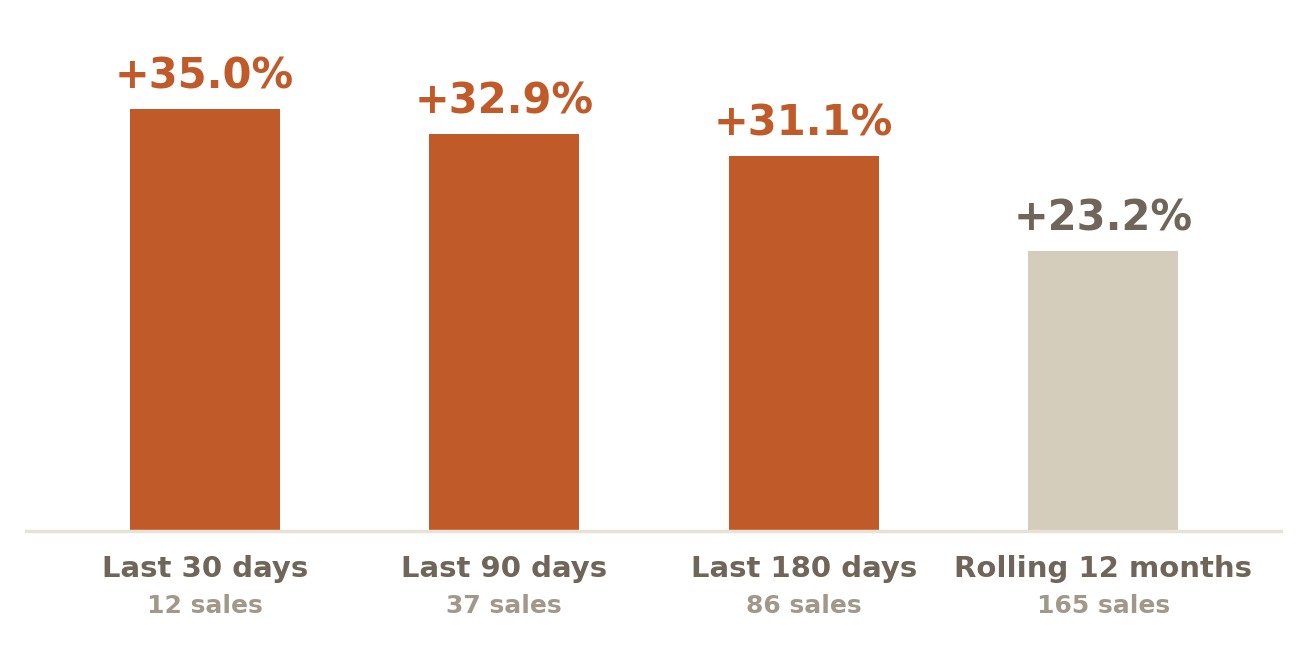
That is an 11.8 point spread in sale-to-list and a $257,500 spread in the median price. It is more than enough room for two honest people to reach opposite conclusions about the same neighborhood, on the same day, and for each of them to be able to prove it.
By the numbers
| Window | Sales | Sold vs asking | Share over asking | Median price | Median days |
|---|---|---|---|---|---|
| Last 30 days | 12 | 135.0% | 100% | $1,987,500 | 12 |
| Last 90 days | 37 | 132.9% | 95% | $1,950,000 | 13 |
| Last 180 days | 86 | 131.1% | 91% | $1,942,500 | 13 |
| Rolling 12 months | 165 | 123.2% | 85% | $1,730,000 | 13 |
A window is a memory
A market statistic is an average over a stretch of time, and the window is how much of the past you have agreed to carry.
A rolling 12-month read on Bernal Heights today is still carrying last September, last November, last January. If the market has moved since then, and it has, then part of what you are reading is a report on a market that no longer exists. Notice what did not change in the table above: the median house still went into contract in twelve or thirteen days in every window. Speed has been constant. Price has not. The window is the only thing separating those two facts.
This is not a flaw in the data. It is the trade every window makes. Short windows are current and jumpy. Long windows are steady and stale. There is no window that is both, and anyone who hands you a single number without telling you its window has made that trade on your behalf without saying so.
The condos are the control group
Here is the same day, citywide, in both lanes. Houses read 125.2% of asking over 30 days, 124.3% over 90 days, and 117.2% over a rolling year. Condos read 100.3%, 100.8% and 100.0%.
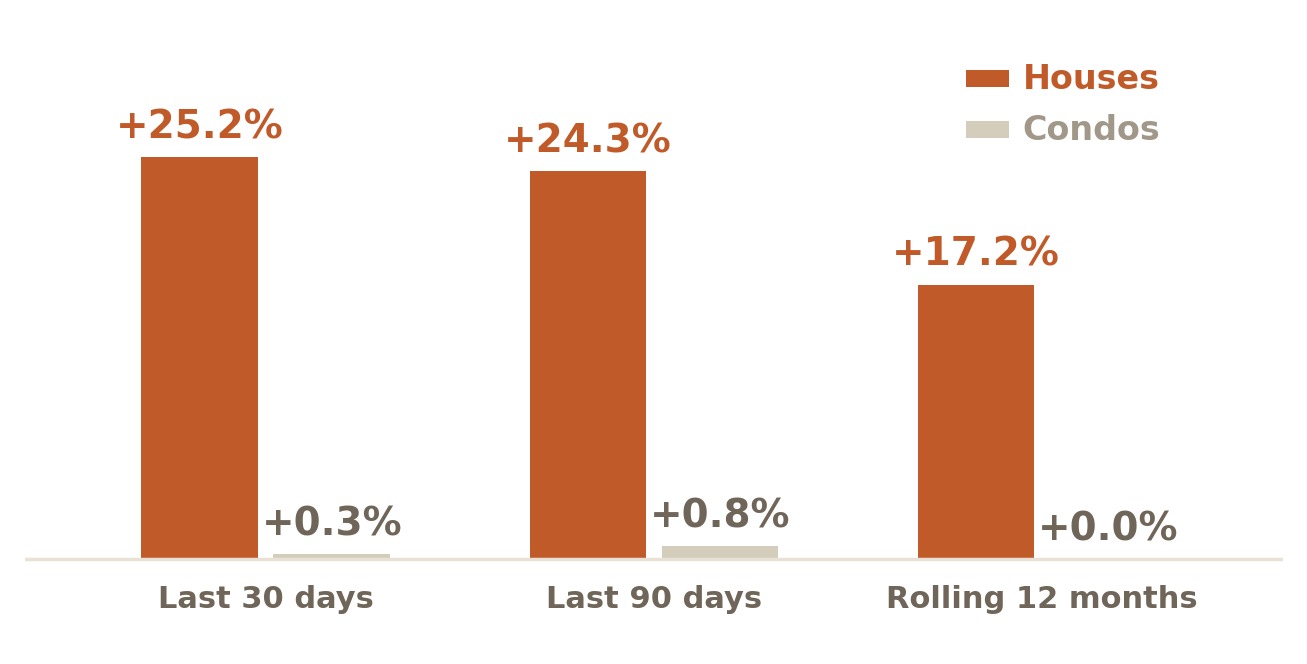
Same city, same day, same method, same analyst. Houses swing eight points depending on which window you pick. Condos swing less than one.
That contrast is what turns the window problem from an annoyance into a tool. When your windows disagree, something is changing. When they agree, it is not. The spread between your short window and your long window is not noise you have to tolerate. It is the measurement of change itself.
Read that way, those two rows say something plain. San Francisco houses are moving, and San Francisco condos have been sitting at almost exactly asking price for a year. That is an interpretation, and it is mine. The six numbers underneath it are facts.
Houses, 30 days against 12 months
8.0 pts
125.2% against 117.2% of asking
citywide, same day, same method; the window you choose moves the answer by eight points
Condos, the same two windows
0.3 pts
100.3% against 100.0% of asking
citywide; when nothing is changing, the window does not matter, and that is the control group
And the movement has a direction
Across the neighborhoods where both the 90-day and the 12-month house reads clear our Strong reliability bar, 21 of 23 show the 90-day running hotter than the 12-month. The median gap is 6.7 points. The two exceptions are Ingleside, at 1.7 points cooler, and Bayview, at 2.9 points cooler.
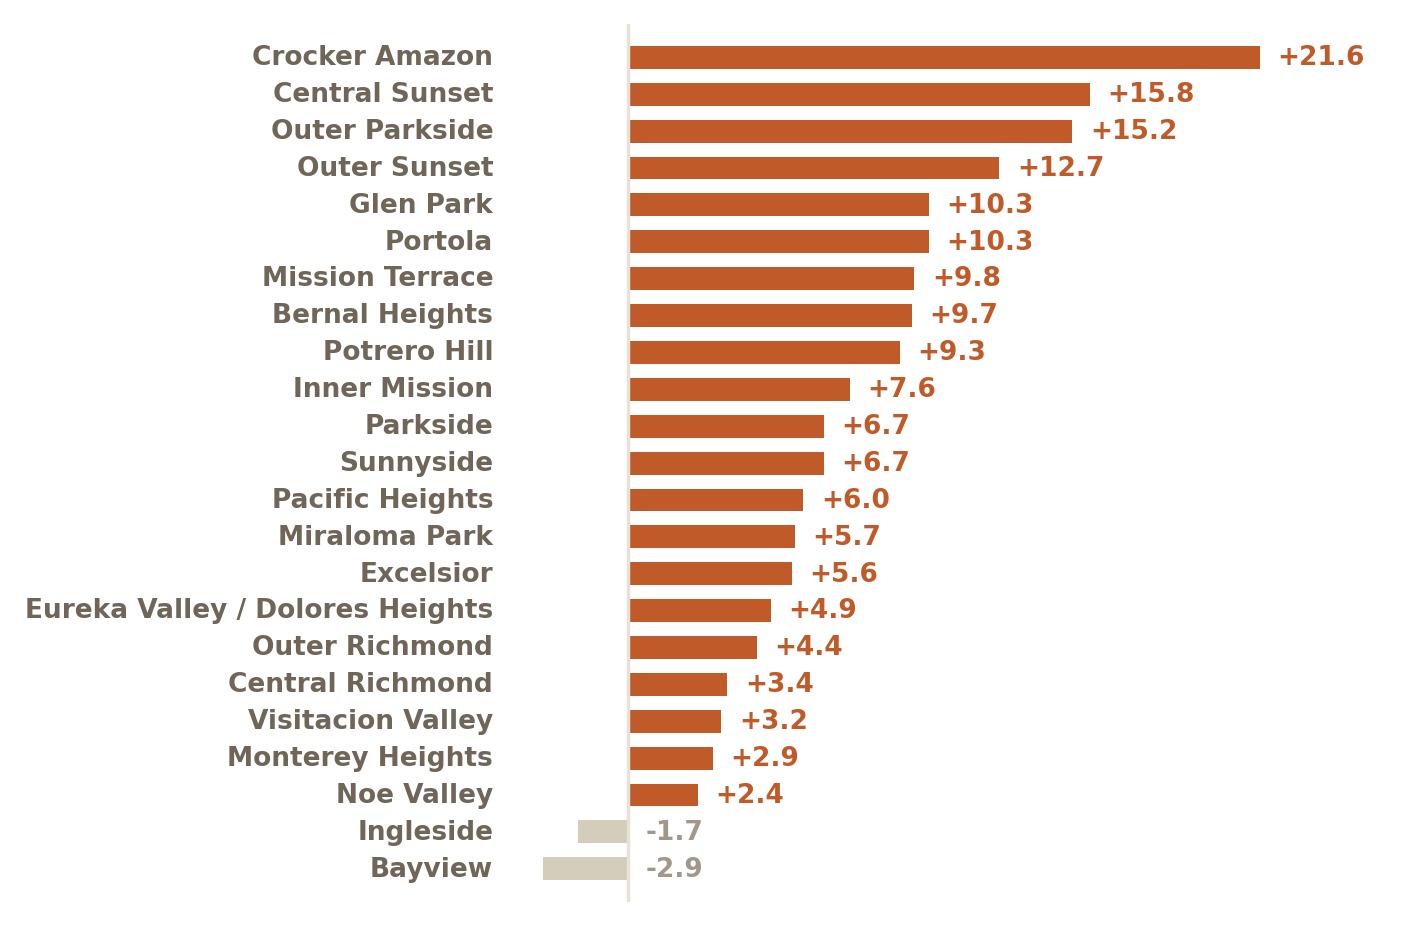
That is the fact. Here is what I take from it.
The rolling 12-month figure is the one most market reports lead with, including reports I respect. Right now it is understating this market almost everywhere in the city. If you are a buyer anchored to a 12-month neighborhood average, you are likely to underbid, not because anyone lied to you, but because you are reading a number whose memory runs back to last summer.
The 30-day window is not the problem. The sample is.
That is only half the story, and the other half cuts the other way. It does not cut the way most market commentary assumes, though. What makes a window trustworthy is not its length. It is how many closed sales are inside it.
At subdistrict level our published bar for a 30-day read is eight closed sales to be labeled Strong and five to be labeled Directional. Across all residential types, 30 of the 90 subdistricts clear that bar right now: 18 Strong and 12 Directional, with 304 sales between them. Citywide, neither lane is anywhere near the line. There were 144 house sales and 194 condo sales in the last 30 days, both comfortably Strong.
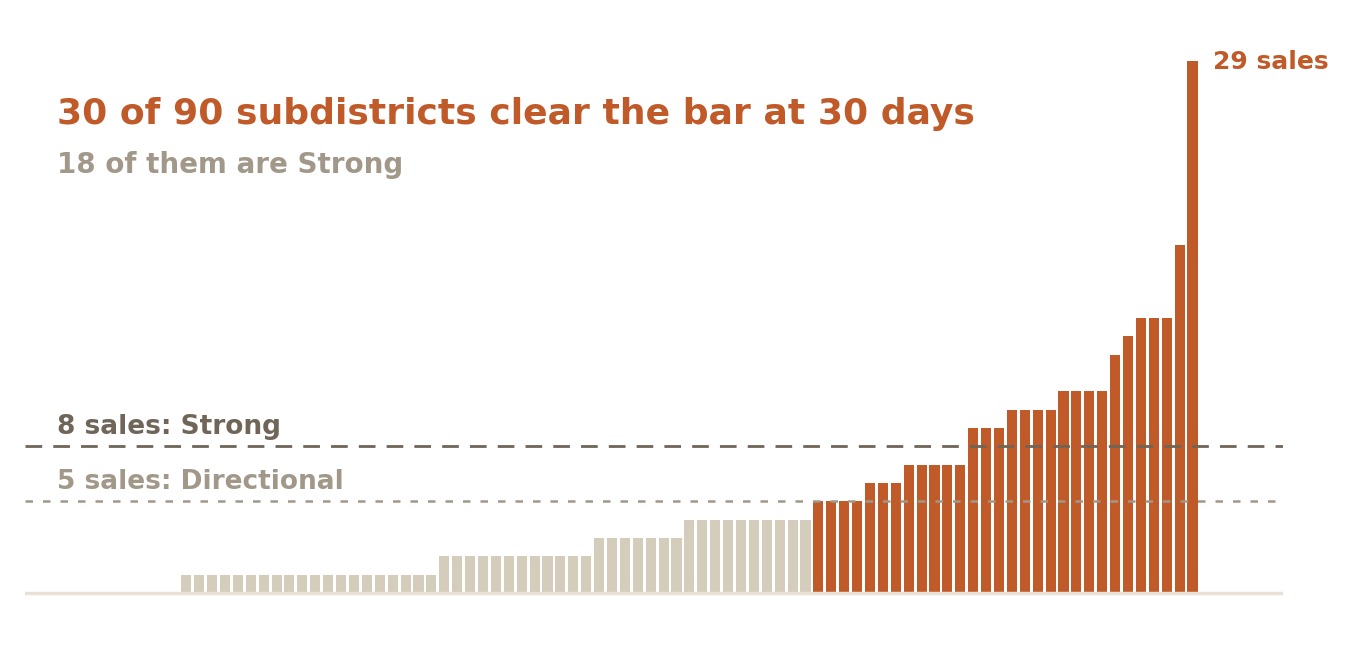
Where the sample clears, the 30-day read is not noise. It is the most current true description of that neighborhood available, and most of the time it agrees with the longer view. Across those 30 neighborhoods the median gap between the 30-day and the 12-month figure is 2.5 points. But eight of them run five or more points ahead of their own annual number and three run five or more behind. Those eleven are the entire signal, and a 12-month figure cannot see any of them.
Glen Park sits 19.2 points ahead of its year on ten sales, Parkside 16.5 ahead on nine. Central Richmond, the neighborhood I live in, is 11.2 ahead on five, which is Directional rather than Strong, so read it as a lean and not a fact. And the short window catches cooling exactly as well as heat: Excelsior is 11.6 points behind its year on nine sales, Eureka Valley and Dolores Heights 10.0 behind on fifteen. An annual average buries both.
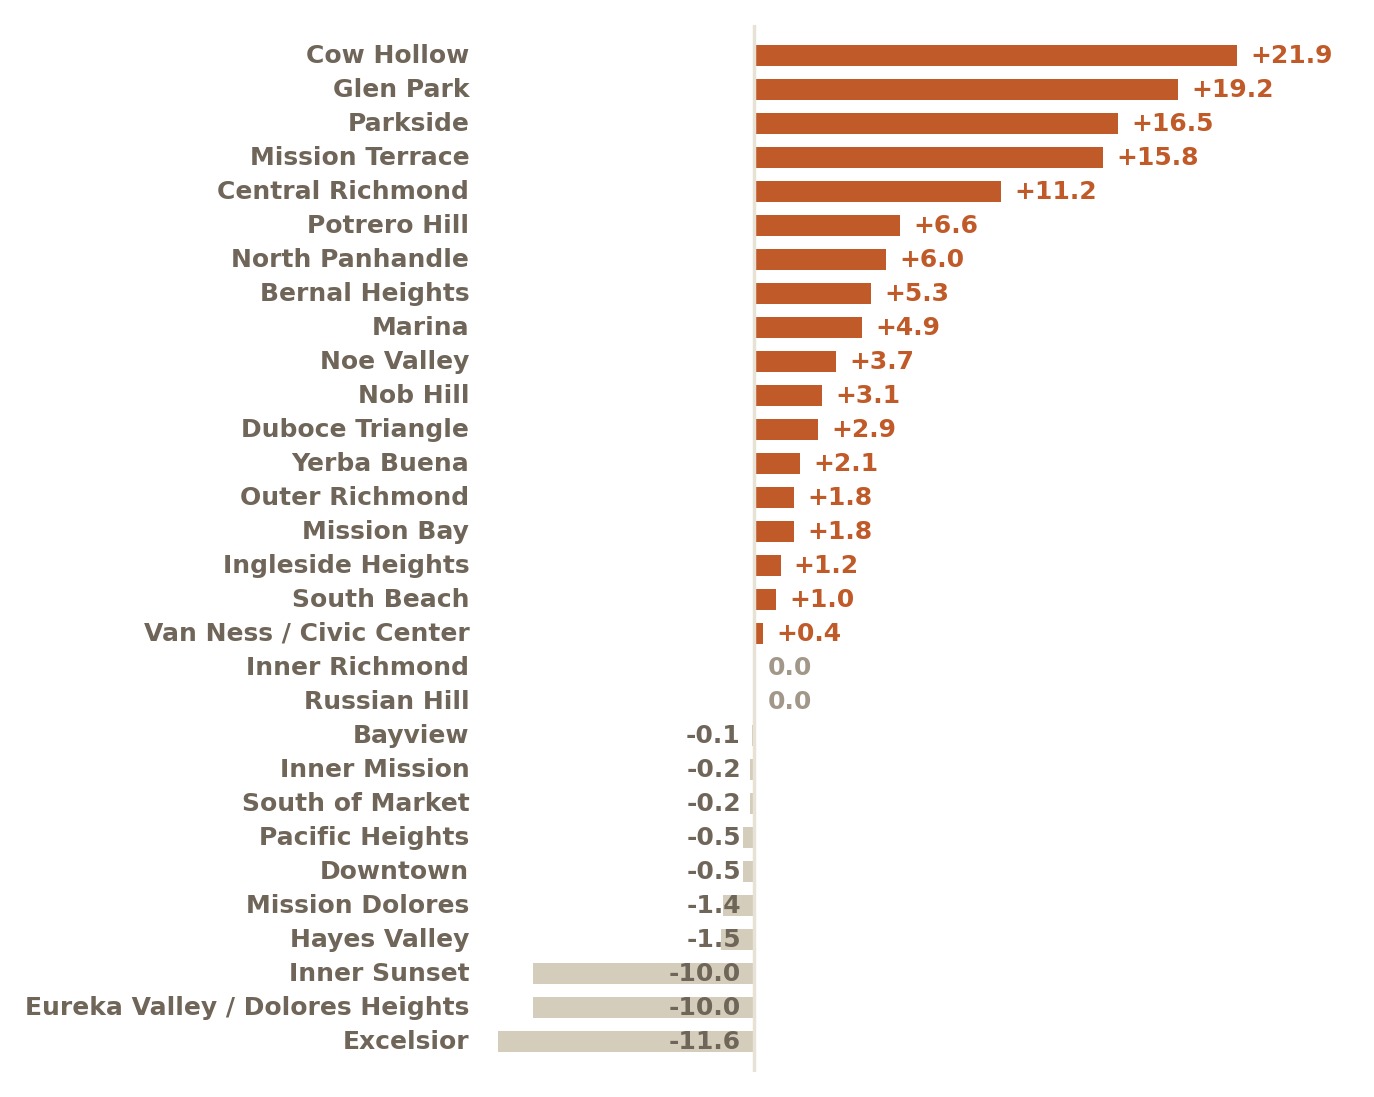
The failure mode is real, and it is a sample failure rather than a window failure. Inner Parkside's 30-day house figure reads 200.4% of asking. That is one house: listed just under a million, sold for two million, thirteen days on market. It is a real sale. Our data quality process flagged it, a human reviewed it, and it cleared. Forest Hill's 30-day house figure is 175.6%, also one house. Neither clears the bar, and neither is published as though it does. That is what the reliability label is for.
So the rule is not use a long window. The rule is use the shortest window your sample supports, and carry the label with the number. That is also the plain reason we added a 180-day window this month. At 90 days, 23 neighborhoods have a Strong read for houses specifically, where samples are thinnest; at 180 days, 35 do.
Why a national convention misreads this city
Everyone who publishes housing data at small geography makes some version of this trade. Redfin builds its weekly numbers on rolling four-week windows and widens to rolling three-month windows for smaller areas, in its own words, to ensure adequate sample sizes. The S&P Cotality Case-Shiller index, the most-cited home price measure in the country, is calculated monthly using a three-month moving average algorithm. Those are good decisions. They are also national instruments, calibrated for a national market.
Here is that national market. Redfin's own dashboard puts the United States at 98.3% of asking, with 24.9% of homes selling above list, as of May 2026. San Francisco houses over the last 30 days sold at 125.2% of asking, with 86.8% over asking, against 110.4% and 71.4% in the same window a year ago.
Those two sets of figures are not measured the same way. Redfin reports an average ratio where this issue reports a median, and their latest national reading is May where ours ends August 6, so they are not interchangeable and I am not presenting them as such. But no difference in treatment explains twenty-seven points.
Notice the other thing in that comparison. The most-cited national housing dashboard is publishing May data in August. That is not sloppiness. It is the smoothing trade working exactly as designed, because in a market sitting flat at 98.3% of asking, three months of lag costs a reader nothing. In a market where houses moved eight points inside a year, and 21 of 23 well-sampled neighborhoods are running hotter over the last 90 days than over the last twelve months, that same lag is expensive. Applying a national smoothing convention to San Francisco right now does not make you conservative. It makes you late.
The difference is not that we solved this. The difference is that we show you the dial, and we print the sample size beside it so you know when you are allowed to turn it.
What to do with this
If you are pricing a house to sell, start with the shortest window your own subdistrict actually supports, and let the sample size decide which one that is. If your neighborhood cleared the bar at 30 days, that is the number closest to the buyers you are about to meet. If it did not, fall back to 90 or 180 days rather than reaching for the citywide figure. And when two windows disagree by more than a few points, your neighborhood is moving; the direction of the disagreement tells you which way.
If you are writing an offer, understand that the 12-month average is currently the friendliest number available to you, which is exactly why it is the wrong one to anchor on. Ask for the 30, 90 and 180-day read on the specific subdistrict, ask how many sales sit inside each, and anchor on the shortest one that clears the bar.
And if someone hands you a market statistic, ask what window it covers and how many sales are in it before you argue about the number itself. Most disagreements about this market are not disagreements about facts. They are two windows talking past each other.
We now publish all four windows side by side on every neighborhood page, each with its sample size and its reliability label. Not because four numbers are friendlier than one. Because one number, without its window, is not an answer. If you want to know which window your own block should be read on, that is a short conversation and I am happy to have it.
AI Corridor Scoreboard
One reading per issue on the city's softest segment, the condos near the new AI offices, so you can watch the turn as it happens.
| Issue | Date | Reading | Call |
|---|---|---|---|
| #16 (this issue) | Aug 6, 2026 | Flat in every window, which this issue argues is the whole point. South Beach condos read 100.0% of asking at 30, 90 and 180 days and 99.0% over the trailing year. South of Market reads 99.4, 99.8, 99.6 and 99.0. Four windows, one answer. Every house lane in this issue moved when the window moved; the corridor did not, and a segment that reads the same no matter how you slice it is a segment that is not turning. | Buyer opening holds, and now it is measured four ways instead of one. |
| #15 | Aug 2, 2026 | Unchanged at the bottom of the same ladder. This issue extended the over-asking gradient into small multifamily, and the corridor still anchors the low end: right at asking, while two-unit buildings cleared 11.7% over and houses 23.8%. The ordering is by how much a property lives like a house, and a corridor tower is the furthest thing from one. | Buyer opening holds, and this issue explains why it persists. |
Show the 13 earlier readings
| Issue | Date | Reading | Call |
|---|---|---|---|
| #14 | Jul 29, 2026 | Read on supply this time, not price. Citywide condo and townhome months of supply fell from 3.9 to 1.7 in a year and active listings from 772 to 480, so even the calmest lane in the city now offers less to choose from. This issue did not re-measure corridor pricing. | Buyer opening holds on price; the shelf behind it is thinner. |
| #13 | Jul 25, 2026 | Graduated to the essay. Back at asking for the first time since 2022, after three springs about 1% below it, and the clock changed: median market time fell from 38 days to 19 and the share selling over asking roughly doubled, from the low twenties to the mid forties. Price at par, speed doubled. | Negotiating room intact; the window now narrows in speed, not price. |
| #12 | Jul 21, 2026 | Still the calm corner, and it proves the point. District 9 condos, SoMa, Mission Bay, and South Beach, sold right at list, about 100%, with only 31% over asking on 836 sales, while mid-priced houses cleared 123 to 127% of list. Condos rarely get listed low to start a war, so the overbid never appears. | Buyer leverage holds where the list-low tactic is not used. |
| #11 | Jul 17, 2026 | Unmoved by the house story. While overbidding ran one tier below the trophy core, the corridor and condo core cleared near asking, and the two flat lanes the field named as spillover candidates, Hayes Valley and Lower Pacific Heights, stayed calm in closed data. | Still the clearest buyer opening in the city. |
| #10 | Jul 14, 2026 | Still soft while the headline is elsewhere. June's million-over-asking story is a west-side and central house market, not the AI-corridor towers. District 9 condos, SoMa, Mission Bay and South Beach, ran about 10% below last year even as volume climbed. Activity returns to the corridor; pricing has not. | Still the clearest buyer opening in the city. |
| #09 | Jul 10, 2026 | Still the soft floor at the halfway mark. District 9 condos, SoMa, Mission Bay, and South Beach, sold near 100% of list with only about 36% over asking on roughly 290 sales this year, while citywide houses ran near 121% of list. The widest lane in the city stays open. | Clearest buyer opportunity holds into the second half. |
| #08 | Jul 5, 2026 | Still the soft floor even as the top books records. District 9 condos, SoMa, Mission Bay, and South Beach, sold near 100% of list with heavy cash and light competition, while $5M+ houses set a decade volume record at about 112% of list on roughly 64% cash. Cash without a crowd here. | Buyer opportunity intact where the crowds are not. |
| #06 | Jun 25, 2026 | Still the calm corner while the house middle runs hot. District 9 condos, SoMa, Mission Bay, and South Beach, sold right at list, about 100%, with only 35% over asking on 300 sales, against the $1.5M to $3M house band at 122 to 125% of list. | Buyer opportunity holds where the bidding wars are not. |
| #05 | Jun 21, 2026 | Cash, not heat. Corridor condos carry heavier cash than the citywide condo average, about 42% versus 37%, yet still sell near 98.7% of list with only about 20% over asking versus 45% citywide. Cash concentrates here; competition does not. | Negotiating room for financed buyers. |
| #04 | Jun 17, 2026 | Still the soft floor while houses raced ahead. Corridor near 98 to 99% of list versus 103.8% citywide and about 123% for single-family in the last 30 days. | Buyer opportunity holds; the gap to houses only widened. |
| #03 | Jun 13, 2026 | Still the bottom of the overbid table. Corridor sale-to-list at about 98 to 99% versus 103.6% citywide, trailing year. | Opportunity intact for negotiators. |
| #02 | Jun 10, 2026 | Turning at the edges. Citywide condos hit 101.4% of list in May; inventory fell to 584 from 905. The corridor towers remain the soft end. | Window narrowing, not closed. |
| #01 | Jun 7, 2026 | Soft. Only 37 to 43% of SoMa, Mission Bay, and downtown condos sold over asking. | Clearest buyer opportunity in the city. |
- One neighborhood, one dataset, one afternoon, four answers. Bernal Heights houses read 135.0%, 132.9%, 131.1% and 123.2% of asking across 30, 90, 180 day and 12-month windows. Every figure is correct. The spread is 11.8 points on sale-to-list and $257,500 on the median price.
- The reason is simple once stated. A window is how much of the past you have agreed to carry. A rolling 12-month read on today's market is still averaging in last September and last January, so part of what you are reading describes a market that has already moved on.
- Condos are the control group, and they are what make this an argument rather than a complaint. Citywide houses read 125.2%, 124.3% and 117.2% across 30, 90 day and 12-month windows. Citywide condos read 100.3%, 100.8% and 100.0%. Houses swing eight points with the window. Condos swing less than one.
- So the gap between windows is a measurement, not an error. When your windows disagree, something is changing and the direction of the disagreement tells you which way. When they agree, it is not.
- The disagreement has a direction almost everywhere. In the 23 neighborhoods where both the 90-day and the 12-month house reads clear the Strong reliability bar, 21 show the 90-day running hotter, at a median gap of 6.7 points. The two exceptions are Ingleside, 1.7 points cooler, and Bayview, 2.9 points cooler.
- The gate is sample size, not window length. Across all residential types, 30 of the 90 subdistricts clear the published 30-day bar right now, 18 of them Strong, and citywide both lanes clear it easily on 144 house sales and 194 condo sales. Where the sample holds, the 30-day read is the most current true description available. Where it does not, you get Inner Parkside's 200.4% on a single sale: a real sale and a useless statistic, which is exactly what the reliability label is there to tell you.
- That is why 180 days exists. At 90 days, 23 neighborhoods carry a Strong house read. At 180, 35 do. It is simply the shortest window in which most of this city clears the bar, and it is the same trade Redfin makes when it widens to three-month windows for smaller areas and the same one behind the three-month moving average in the Case-Shiller index.
- The practical version: price and bid from the 90-day and 180-day read on your own subdistrict, carry the sample size alongside the number, and treat any market statistic without a stated window as incomplete rather than wrong.
All four windows are live for every San Francisco neighborhood in the market explorer, each with its sample size and reliability label. Read your own subdistrict before you price, bid, or argue.
Methodology and sources
Source: POTM Command, governed MLS analytics, as of August 6, 2026, covering 62,783 deduplicated closed San Francisco sales. Sale-to-list is the median across sales in the window of each sale's close price divided by its list price; a home that sold at 135.0% closed 35% over asking. Windows are anchored to the most recent data pull and are inclusive of the end date, so the 90-day window in this issue runs May 9 through August 6, 2026. Houses are single-family residences; condos include townhomes. Records are deduplicated to one closed event per listing, keeping the most recently ingested version. Sale-to-list values outside a 50 to 250 percent band are excluded as data-entry errors, as are quarantined records that have not passed review; 3 outliers and 6 quarantined events are excluded citywide. The 200.4% Inner Parkside sale was quarantined on ingest, reviewed, and released before this data pull, so it is included and is not an error. Reliability labels are sample-size thresholds published with the data: at subdistrict level a 180-day read needs 12 closed sales to be labeled Strong, 8 for Directional. The 21-of-23 neighborhood count requires a Strong label in BOTH the 90-day and the 12-month window, so it is a narrower and more conservative set than the count of neighborhoods Strong at 180 days alone, which is 35. Citywide figures are published for 30-day, 90-day and 12-month windows; the 180-day window is published at neighborhood level, which is why the citywide comparison in this issue shows three windows and the Bernal Heights table shows four. Neighborhood counts throughout refer to house sales only, so a neighborhood can be well sampled for houses and thin for condos in the same window. Strong is a statement about sample size, not about certainty; a well-sampled neighborhood can still surprise you. The Bernal Heights figures were verified cell by cell against the underlying warehouse on August 8, 2026. Second sources, cited for method only and not for any San Francisco figure: Redfin, Data Center methodology, which builds weekly metrics on rolling four-week windows and widens to rolling three-month windows for smaller areas to ensure adequate sample sizes; and S&P Dow Jones Indices, S&P Cotality Case-Shiller Home Price Indices, which are calculated monthly using a three-month moving average algorithm. Reliability bars for a 30-day subdistrict read are 8 closed sales for Strong and 5 for Directional. Two different grains appear in this issue and they are labeled wherever they are used: neighborhood counts about houses specifically (23 Strong at 90 days, 35 at 180) are single-family only, while the 30-day coverage figures (30 of 90 subdistricts, 18 Strong, 304 sales) are all residential types combined, which is why the second number is so much larger than the first. National figures are from Redfin's US housing market dashboard, 98.3% sale-to-list and 24.9% of homes sold above list, as of May 2026. Redfin reports an average sale-to-list ratio and a May reading, where this issue reports medians in a window ending August 6, 2026, so the two are not interchangeable and are not presented as such; they are shown to size a gap far larger than any difference in treatment. Data deemed reliable but not guaranteed, subject to change, correction, and revision. General information, not legal, tax, or financial advice, and not a forecast.
What does this Pulse mean for your block?
Two homes five blocks apart can carry very different risk. Let's talk about your specific segment, no pressure.