
POTM Blog Issue #15, August 2, 2026
The Last Building You Can Live In
Issue #13 built a ladder: the more a home lives like a house, the more it trades like one. Issue #14 showed why that pressure exists at all. There is one more rung on that ladder, and almost nobody covers it. You can live in a triplex or a fourplex. But a duplex is the last building where the half you keep is still the size of a house. This spring, San Francisco buyers paid for that difference. The buildings that hand their owner less did not move at all.
By Paulo Serna, San Francisco Real Estate Agent, Compass | Level Up Group · CA DRE# 02150409 · Published August 2, 2026
Data source Paulo’s Pulse, governed SFAR MLS data
Two issues ago I traced the pressure out of the house market and into the condos and TICs that live most like houses. When a San Francisco house sells 23.8% over asking in eleven days, the buyers who lose do not vanish. They move to whatever still feels like the home they wanted. That issue ended on a ladder: the more a home lives like a house, the more it now trades like one.
Last issue explained why that pressure exists at all. Months of supply across the city sit at levels that make a bidding war the default condition rather than a mood. Scarcity is the engine. The ladder is where the pressure goes.
There is one more rung on that ladder, and it is the one almost nobody writes about. Go past the condo, past the TIC, and you arrive at a building with two front doors. A duplex. In San Francisco it is usually a single Edwardian or Marina-style building split into an upper and a lower flat. This spring, priced-out house buyers found it.
Eleven springs, and then this one
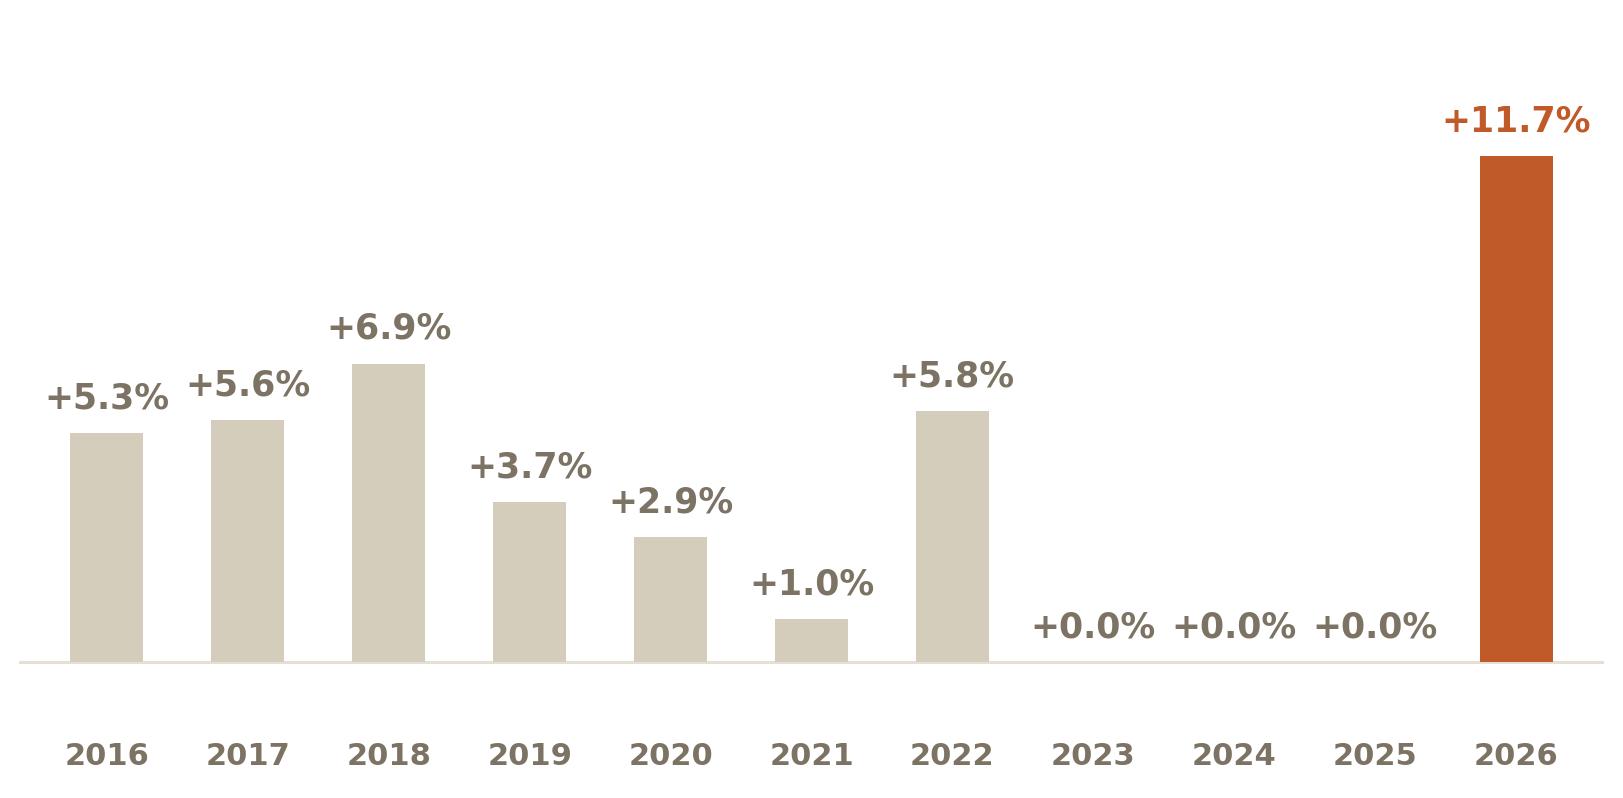
San Francisco 2-unit buildings sold a median 11.7% over asking between March and late July. In the same window a year ago they sold at asking, exactly. The year before that, at asking. The year before that, at asking. Three flat springs, then a jump that clears the previous high in this data, the 6.9% over asking of spring 2018, by a wide margin. Sixty-nine percent of them sold over asking, against half a year ago, and the median one sold in fifteen days instead of twenty-one, the fastest spring in the eleven years tracked here.
The ladder, completed
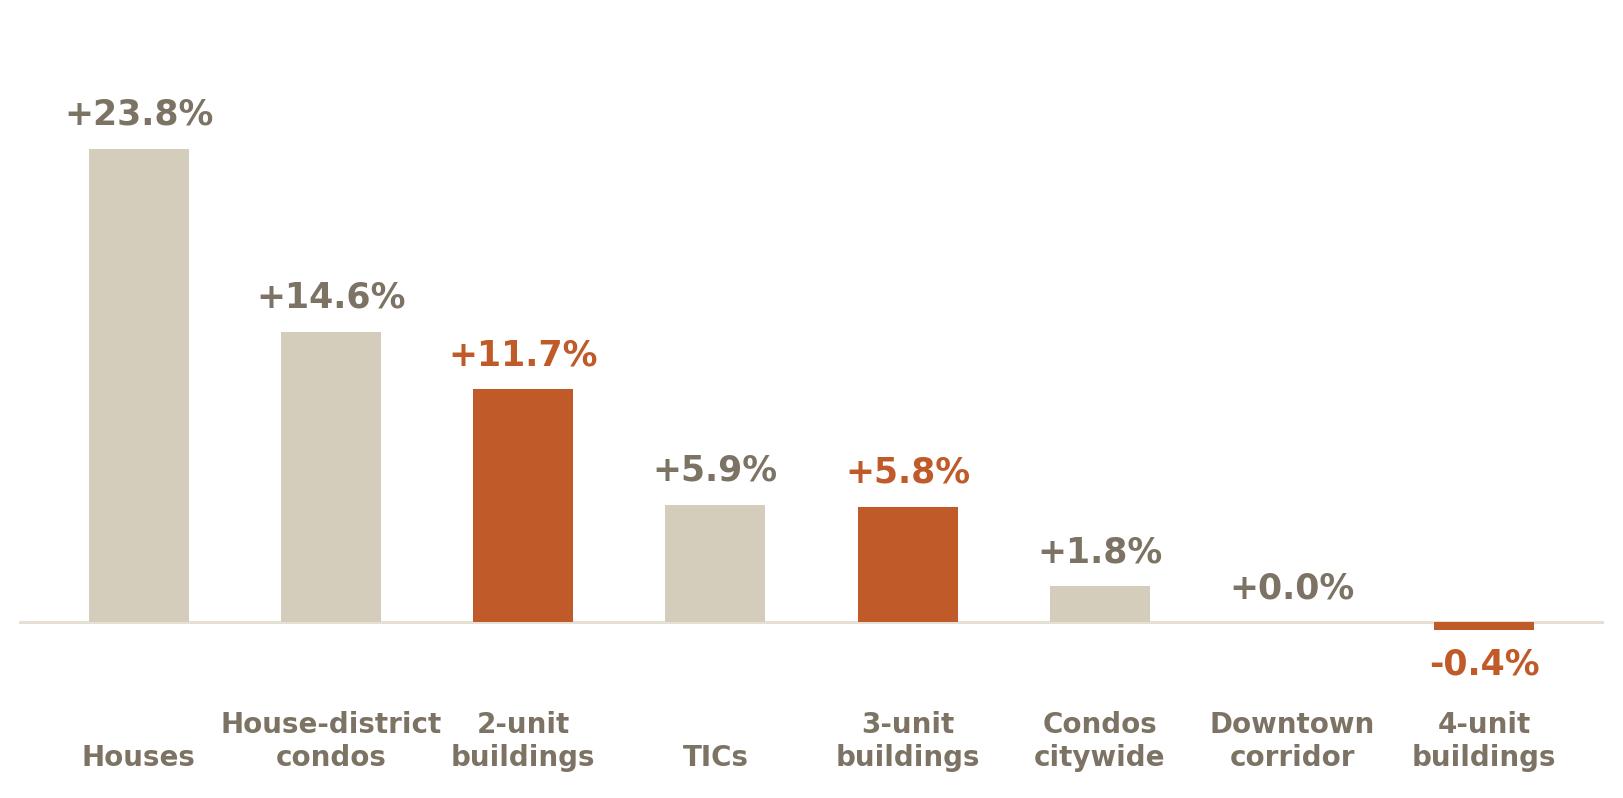
Place that reading next to everything else the city did this spring and the pattern from Issue #13 does not just hold, it extends cleanly. Houses citywide, 23.8% over asking. Two and three bedroom condos in the house districts, 14.6%. Two-unit buildings, 11.7%. TICs, 5.9%. Three-unit buildings, 5.8%. Condos citywide, 1.8%. The downtown corridor, right at asking. And at the bottom, four-unit buildings, still closing a touch below the list price.
Read the ladder from the top and it is not sorted by price, or by neighborhood, or by size. It is sorted by how much each property behaves like a house. A duplex sits above a TIC and just below a house-district condo, which is exactly where a building you can live in belongs.
By the numbers
| Segment | Median price | Median $/sq ft | Typical sale vs asking | Share over asking | Sales |
|---|---|---|---|---|---|
| 2-unit buildings, 2026 | $2.15M | $813 | +11.7% | 69% | 114 |
| 2-unit buildings, 2025 | $1.65M | $664 | at asking | 50% | 117 |
| 3-unit buildings, 2026 | $2.18M | $624 | +5.8% | 70% | 44 |
| 3-unit buildings, 2025 | $2.00M | $549 | +0.2% | 58% | 33 |
| 4-unit buildings, 2026 | $1.89M | $551 | 0.4% below | 47% | 34 |
| 4-unit buildings, 2025 | $1.63M | $500 | 4.4% below | 17% | 23 |
| All 2-4 unit, 2026 | $2.11M | $710 | +6.4% | 66% | 192 |
| All 2-4 unit, 2025 | $1.69M | $615 | at asking | 47% | 173 |
Every unit you add, the market pays less for
The clearest way to see it is to walk up the building sizes one at a time. Two units: 11.7% over asking. Three units: 5.8% over, itself a high for that lane, which had never cleared 2% in any spring in this data. Four units: 0.4% under asking. Same city, same spring, same lending conditions, same twenty-block radius in many cases. The only variable that changes is how many front doors the building has, and the market pays less for each one you add.
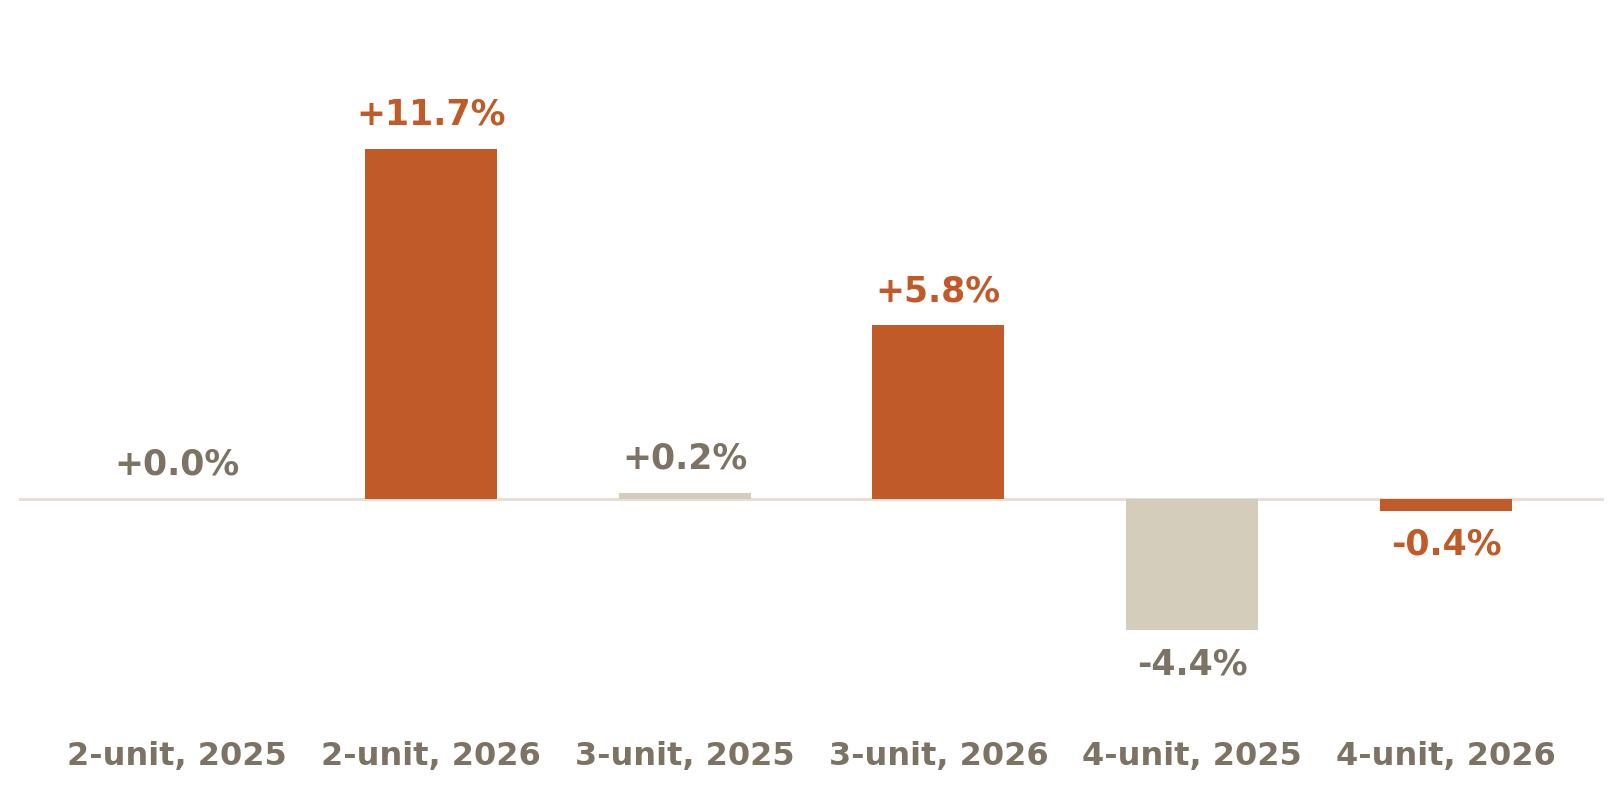
Two honest notes before that becomes a headline. The three and four unit samples are 44 and 34 closings. That is directional, not robust, and I will not pretend otherwise. And the four-unit lane has been below asking every spring since 2022, so its move from 4.4% under to 0.4% under is a genuine improvement, just not a turn.
The building you can move into
+11.7%
over asking, $2.15M median
2-unit buildings; 69% sold over asking, in 15 days, at a ten-year high of $813 a foot
The building you have to underwrite
-0.4%
under asking, $1.89M median
4-unit buildings; still the one small multifamily lane where a buyer can negotiate on price
The part that is not a mix effect
A median can lie when the homes selling get bigger, and this spring they did: the median 2-unit sale was about 10% larger than last year's. So the median price, up from $1.65M to $2.15M, is doing two jobs at once and should not be quoted alone. The figure that survives the test is price per square foot, which strips size out. Two-unit buildings went from $664 a foot to $813, a 22% jump and the highest reading in ten years, past even the $789 of 2020. Whatever is happening here, it is not a handful of bigger buildings dressing up an average. Buyers are paying more for the same square foot.
A second source, pointed the same way
Everything above comes from POTM Command, my own governed pull of the San Francisco MLS. It is fair to ask whether an independent read of the same market says the same thing.
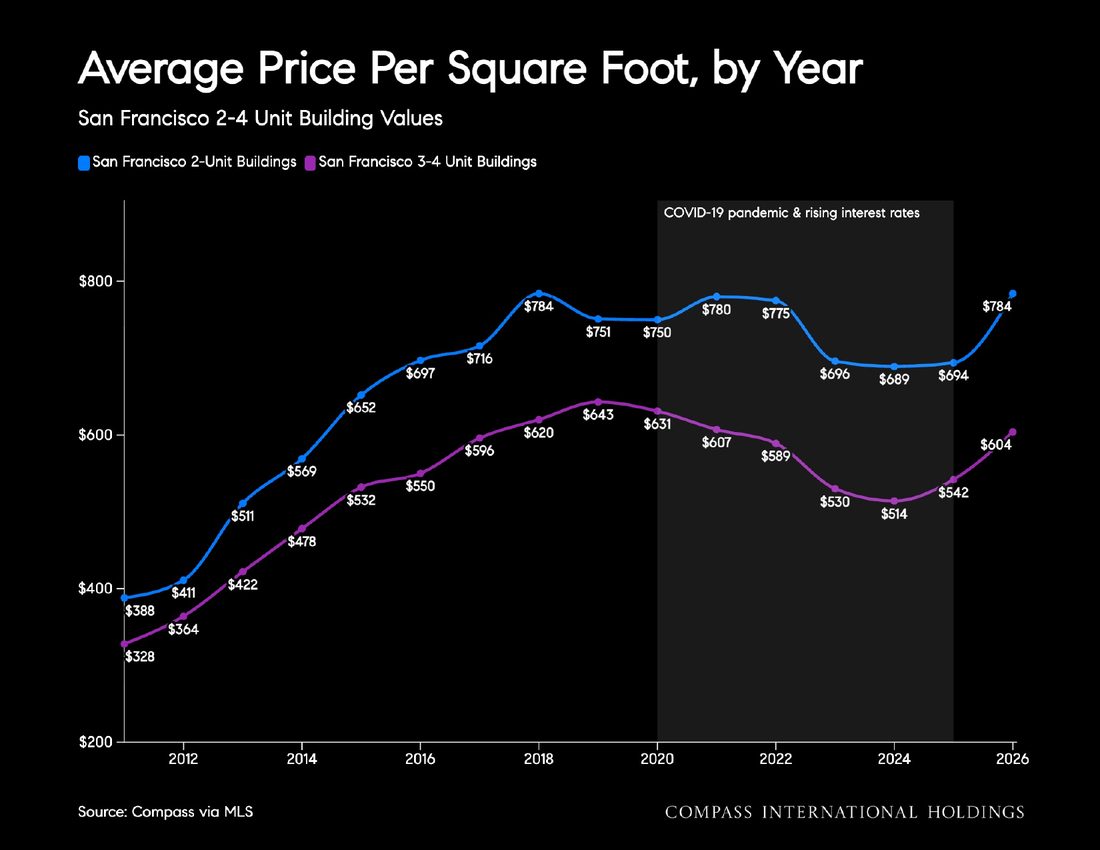
Compass published its own San Francisco 2-4 unit report in July, built from the same MLS but measured differently: full-year windows instead of a season-matched spring, and averages where I use medians. Two of its pages line up with the reading above closely enough to be worth showing.
The first is a fifteen-year price-per-square-foot series, and it carries the same two-tier structure. Two-unit buildings sit at $784 a foot in 2026, level with their all-time high. Three and four unit buildings sit at $604, still short of the $643 they reached in 2019. Two lanes, one recovered to a record, one not.
The second is absorption, the share of listings under contract. Compass reads 56% for small multifamily in the second quarter of 2026, up from 32% the quarter before and the highest figure in the ten years its chart covers. Their report does not comment on it. It is the most striking number in that section, and it is independent corroboration that demand for these buildings jumped this spring, rather than supply simply thinning underneath a flat level of interest.
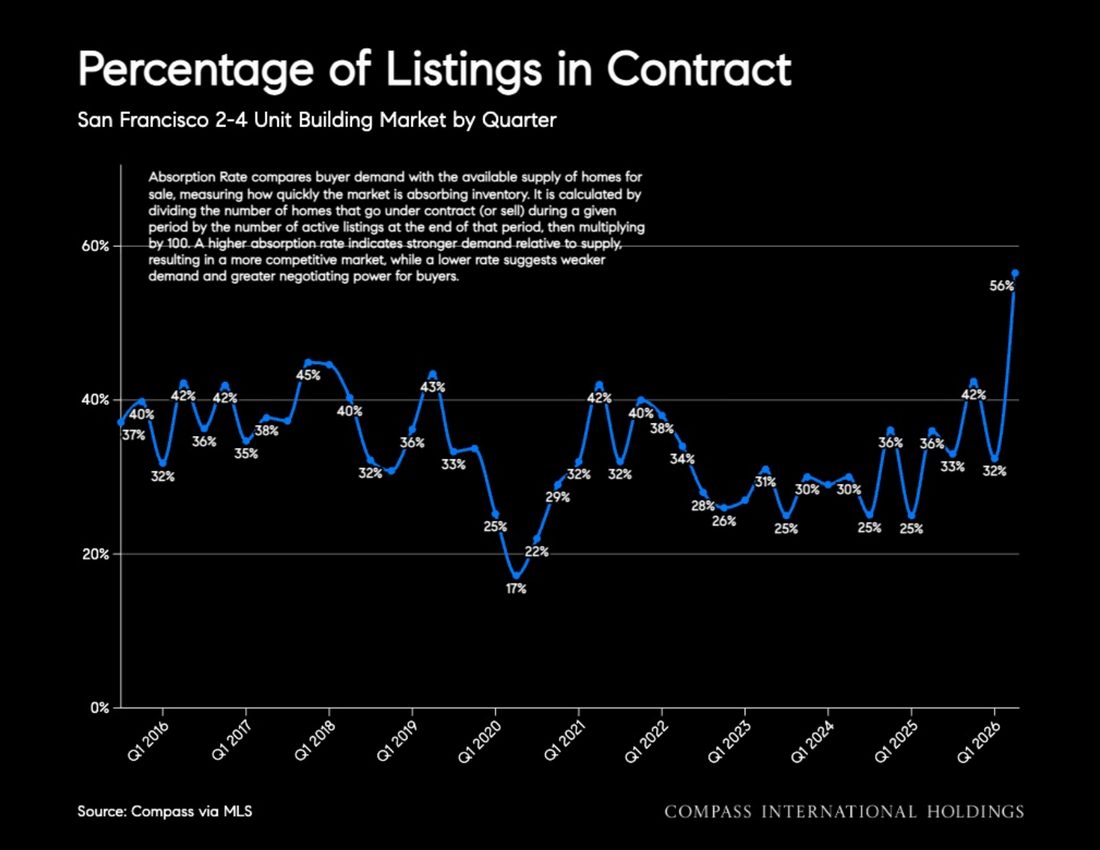
One difference is worth naming, because it explains why this gradient is not already common knowledge. Compass reports three-unit and four-unit buildings as a single blended line in its headline charts. That is ordinary practice across multifamily reporting, and it is exactly what hides the pattern in this issue: blend a lane that made a new high with one that did not, and the average describes neither. Their own twelve-month building-values table, which does split by unit count, shows the same descending order I found: $665 a foot for two-unit buildings, $625 for three-unit, $571 for four-unit.
Two sources, different windows, different methods, same shape.
Why the duplex and not the fourplex
This is interpretation rather than measurement, and I want to be clear about which is which. The data shows the gradient. It does not explain it. But the explanation that fits every number in this issue is that the marginal buyer of a San Francisco duplex in 2026 is not an investor. It is a household.
Start with what an owner actually keeps, because that is where the gradient begins. Nothing stops a buyer from living in a triplex or a fourplex; small multifamily is residential property and it finances that way. But the share of the building you occupy shrinks fast. The median duplex sold this spring was 2,925 square feet, so one flat runs about 1,462. The median triplex was bigger overall, 3,656 feet, but that is roughly 1,218 a unit. The median fourplex, 3,665 feet, works out to about 916. Now put the prices next to that: the duplex and the triplex cost almost exactly the same, $2.15M against $2.18M. For the same money, the duplex buyer lives in about twenty percent more home. That is the whole argument in one line.
Everything else follows from it. A duplex finances closer to a house than to a commercial asset. It appraises against other small residential buildings. When a house in the same neighborhood costs $2.1M and takes 24% over asking to win, a duplex at $2.15M that comes with rent attached and a house-sized flat to live in stops looking like an investment product and starts looking like a strategy.
A fourplex cannot make that argument. It gets underwritten on a cap rate, and while financing has genuinely improved, it has not improved enough to change who the buyer is. Compass puts the average multifamily rate at 6.9% in 2024, 6.5% in 2025, and 5.5% so far in 2026. That relief is real, and the three and four unit lane did respond to it. But responding is not the same as repricing. Rate relief lifted both lanes; only the lane with a household buyer made a new high. The capital chasing San Francisco right now is household wealth looking for a place to live, not yield looking for a return. The buildings that can absorb the first kind repriced. The buildings that need the second kind improved, and stopped.
What to do with this
If you own a two-unit building, this is the strongest pricing position that lane has had in a decade, and it is stronger than the multifamily headlines suggest, because the multifamily headlines average you in with the fourplexes that never moved. Price it as the house-adjacent property it is, not as a small apartment building.
If you are buying one, budget from closed sales rather than list prices, the same lesson house buyers learned two years ago, and expect company at the open house. And if the building comes with a tenant in place, that is not a footnote. San Francisco rent control and just-cause protections follow the building, not the seller. Owner move-in has strict requirements, waiting periods, and real exposure. A buyout is a regulated negotiation with a person who has a home. Every one of those belongs in your budget and in front of a qualified landlord and tenant attorney before you write an offer, not after. I am not one, and nothing here is legal advice.
And if the numbers do not work once you have priced all of that honestly, the right answer may be to wait, or to buy the house after all. That is a real outcome, and it is worth arriving at on purpose.
The arc that started with a million-over headline ends, for now, on a building with two front doors. Every issue in it has described the same force from a different angle, and this is the last rung where that force still reaches. Whether the duplex holds this position through the fall is the open question, and it depends on whether the households doing the buying keep finding the math worth it. I will be tracking it, and if you own one, are shopping for one, or are weighing whether a small building belongs in your plan at all, that is exactly the conversation I am here for.
AI Corridor Scoreboard
One reading per issue on the city's softest segment, the condos near the new AI offices, so you can watch the turn as it happens.
| Issue | Date | Reading | Call |
|---|---|---|---|
| #15 (this issue) | Aug 2, 2026 | Unchanged at the bottom of the same ladder. This issue extended the over-asking gradient into small multifamily, and the corridor still anchors the low end: right at asking, while two-unit buildings cleared 11.7% over and houses 23.8%. The ordering is by how much a property lives like a house, and a corridor tower is the furthest thing from one. | Buyer opening holds, and this issue explains why it persists. |
| #14 | Jul 29, 2026 | Read on supply this time, not price. Citywide condo and townhome months of supply fell from 3.9 to 1.7 in a year and active listings from 772 to 480, so even the calmest lane in the city now offers less to choose from. This issue did not re-measure corridor pricing. | Buyer opening holds on price; the shelf behind it is thinner. |
Show the 12 earlier readings
| Issue | Date | Reading | Call |
|---|---|---|---|
| #13 | Jul 25, 2026 | Graduated to the essay. Back at asking for the first time since 2022, after three springs about 1% below it, and the clock changed: median market time fell from 38 days to 19 and the share selling over asking roughly doubled, from the low twenties to the mid forties. Price at par, speed doubled. | Negotiating room intact; the window now narrows in speed, not price. |
| #12 | Jul 21, 2026 | Still the calm corner, and it proves the point. District 9 condos, SoMa, Mission Bay, and South Beach, sold right at list, about 100%, with only 31% over asking on 836 sales, while mid-priced houses cleared 123 to 127% of list. Condos rarely get listed low to start a war, so the overbid never appears. | Buyer leverage holds where the list-low tactic is not used. |
| #11 | Jul 17, 2026 | Unmoved by the house story. While overbidding ran one tier below the trophy core, the corridor and condo core cleared near asking, and the two flat lanes the field named as spillover candidates, Hayes Valley and Lower Pacific Heights, stayed calm in closed data. | Still the clearest buyer opening in the city. |
| #10 | Jul 14, 2026 | Still soft while the headline is elsewhere. June's million-over-asking story is a west-side and central house market, not the AI-corridor towers. District 9 condos, SoMa, Mission Bay and South Beach, ran about 10% below last year even as volume climbed. Activity returns to the corridor; pricing has not. | Still the clearest buyer opening in the city. |
| #09 | Jul 10, 2026 | Still the soft floor at the halfway mark. District 9 condos, SoMa, Mission Bay, and South Beach, sold near 100% of list with only about 36% over asking on roughly 290 sales this year, while citywide houses ran near 121% of list. The widest lane in the city stays open. | Clearest buyer opportunity holds into the second half. |
| #08 | Jul 5, 2026 | Still the soft floor even as the top books records. District 9 condos, SoMa, Mission Bay, and South Beach, sold near 100% of list with heavy cash and light competition, while $5M+ houses set a decade volume record at about 112% of list on roughly 64% cash. Cash without a crowd here. | Buyer opportunity intact where the crowds are not. |
| #06 | Jun 25, 2026 | Still the calm corner while the house middle runs hot. District 9 condos, SoMa, Mission Bay, and South Beach, sold right at list, about 100%, with only 35% over asking on 300 sales, against the $1.5M to $3M house band at 122 to 125% of list. | Buyer opportunity holds where the bidding wars are not. |
| #05 | Jun 21, 2026 | Cash, not heat. Corridor condos carry heavier cash than the citywide condo average, about 42% versus 37%, yet still sell near 98.7% of list with only about 20% over asking versus 45% citywide. Cash concentrates here; competition does not. | Negotiating room for financed buyers. |
| #04 | Jun 17, 2026 | Still the soft floor while houses raced ahead. Corridor near 98 to 99% of list versus 103.8% citywide and about 123% for single-family in the last 30 days. | Buyer opportunity holds; the gap to houses only widened. |
| #03 | Jun 13, 2026 | Still the bottom of the overbid table. Corridor sale-to-list at about 98 to 99% versus 103.6% citywide, trailing year. | Opportunity intact for negotiators. |
| #02 | Jun 10, 2026 | Turning at the edges. Citywide condos hit 101.4% of list in May; inventory fell to 584 from 905. The corridor towers remain the soft end. | Window narrowing, not closed. |
| #01 | Jun 7, 2026 | Soft. Only 37 to 43% of SoMa, Mission Bay, and downtown condos sold over asking. | Clearest buyer opportunity in the city. |
- Two-unit buildings sold a median 11.7% over asking this spring, against exactly at asking in the same window a year ago. That is the highest reading in the eleven springs this data covers, and it clears the previous peak of 6.9% in 2018 by a wide margin.
- The gradient is the story. Sort every kind of San Francisco home by how much it beat its asking price and you get a ladder: houses 23.8% over, house-district condos 14.6%, 2-unit buildings 11.7%, TICs 5.9%, 3-unit buildings 5.8%, condos citywide 1.8%, and 4-unit buildings still a touch under. The more a property lives like a house, the more it now trades like one.
- Price per square foot corroborates it, which matters because the median 2-unit sale also got about 10% larger. Per foot, 2-unit buildings went from $664 to $813, a 22% jump and a ten-year high, past the $789 of 2020. That is a real repricing, not a mix effect.
- Fourplexes never joined. They closed 0.4% below asking, have not sold above asking in any spring since 2022, and still take 26 days against the duplex's 15. Financing has eased, from an average 6.9% in 2024 to 5.5% so far in 2026, and that lane did improve. But three and four unit buildings are still priced below their 2019 peak per square foot while two-unit buildings have matched their all-time high. Rate relief lifted both. Only one made a new high.
- An independent read agrees. Compass's own July 2-4 unit report shows the same two-tier structure over fifteen years, and reads absorption at 56% in the second quarter, the highest in the decade its chart covers. It blends three and four unit buildings into a single line in its headline charts, which is exactly what keeps this gradient out of most multifamily coverage.
- What an owner keeps is the likeliest reason why. Nothing stops a buyer from occupying a triplex or a fourplex, but the median duplex sold this spring works out to about 1,462 square feet a unit, against 1,218 for a triplex and 916 for a fourplex, while a duplex and a triplex cost almost the same, $2.15M against $2.18M. For the same money the duplex buyer lives in roughly twenty percent more home.
- If you own a 2-unit building, this is the strongest pricing position that lane has had in a decade. If you are buying one, budget from closed sales and expect company. And if you are buying one with a tenant in place, the rent control and just-cause questions are not a detail you sort out after the offer.
- Three and four unit samples are 44 and 34 closings. Read them as directional. The 2-unit reading, at 114 closings, is not.
Every lane in this issue is live in the market explorer. Switch the property type to multifamily and read your own block. If you own or are buying small multifamily in San Francisco, the small investors page is the companion to this issue.
Sources and further reading
- U.S. Census Building Permits Survey, which separates 2-unit and 3-to-4-unit permits
- Terner Center, UC Berkeley, on missing-middle and small multifamily feasibility
- Topic: house, condo, or TIC, three different markets
- Buying a condo vs. a TIC in San Francisco
- Small investors: duplexes, TICs, and 2 to 4 unit buildings
- How I read the San Francisco market, the method behind these figures
Methodology and sources
Source: POTM Command governed MLS analytics, refreshed July 26, 2026. Closed San Francisco sales in season-matched windows, March 1 to July 24 of each year, the same window used in Issue #13 so the lanes are directly comparable. Small multifamily is drawn from the MLS residential income and multifamily family: 2-unit buildings are duplexes, 3-unit are triplexes, 4-unit are quadruplexes. Buildings of five or more units, and multi-unit properties classified as houses or condominiums, are excluded. Sales with a reported sale price above twice the list price are excluded as data-entry errors, as are records that fail the data-quality gate. Figures are medians or rates within each segment. The typical margin over asking is the median sale price relative to asking; a home sold 11.7% over asking closed at 111.7% of its list price. The share sold over asking is always labeled as a share. House, condo, and TIC figures in the ladder chart are quoted from Issue #13 as published. Sample sizes for 2026: 2-unit 114 closings, strong; 3-unit 44 and 4-unit 34, both directional and labeled as such wherever they appear. Median building size for 2-unit sales rose roughly 10% year over year, so the price-per-square-foot figure is the mix-adjusted read and the median price is not. Per-unit floor area is the median building size divided by the unit count, an approximation of what one flat runs rather than a measured unit-level figure; spring 2026 medians are 2,925 square feet for a duplex, 3,656 for a triplex and 3,665 for a fourplex. Owner occupancy is possible in any of these; the claim here is about how much of the building an owner keeps, not about eligibility. Second source: figures and exhibits attributed to Compass are from Compass, The San Francisco 2-4 Unit Apartment Building Market, July 2026, data through June 2026: the price-per-square-foot series on page 17, the absorption series on page 19, the mortgage-rate figures on page 23, and the twelve-month building-values table on page 25, source Compass via MLS throughout. Compass measures full-year and quarterly windows and uses averages for price per square foot, where this issue uses season-matched spring windows and medians, so the two sets of figures are not interchangeable and are not presented as such. They are shown because they point the same direction from different data treatment. Exhibits are reproduced with attribution for commentary and comparison. Data deemed reliable but not guaranteed, subject to change, correction, and revision. General information, not legal, tax, or financial advice. Rent control, just cause, owner move-in, and buyout rules are specific to the building and to the household; consult a qualified landlord and tenant attorney before relying on any of it.
What does this Pulse mean for your block?
Two homes five blocks apart can carry very different risk. Let's talk about your specific segment, no pressure.